Loading...
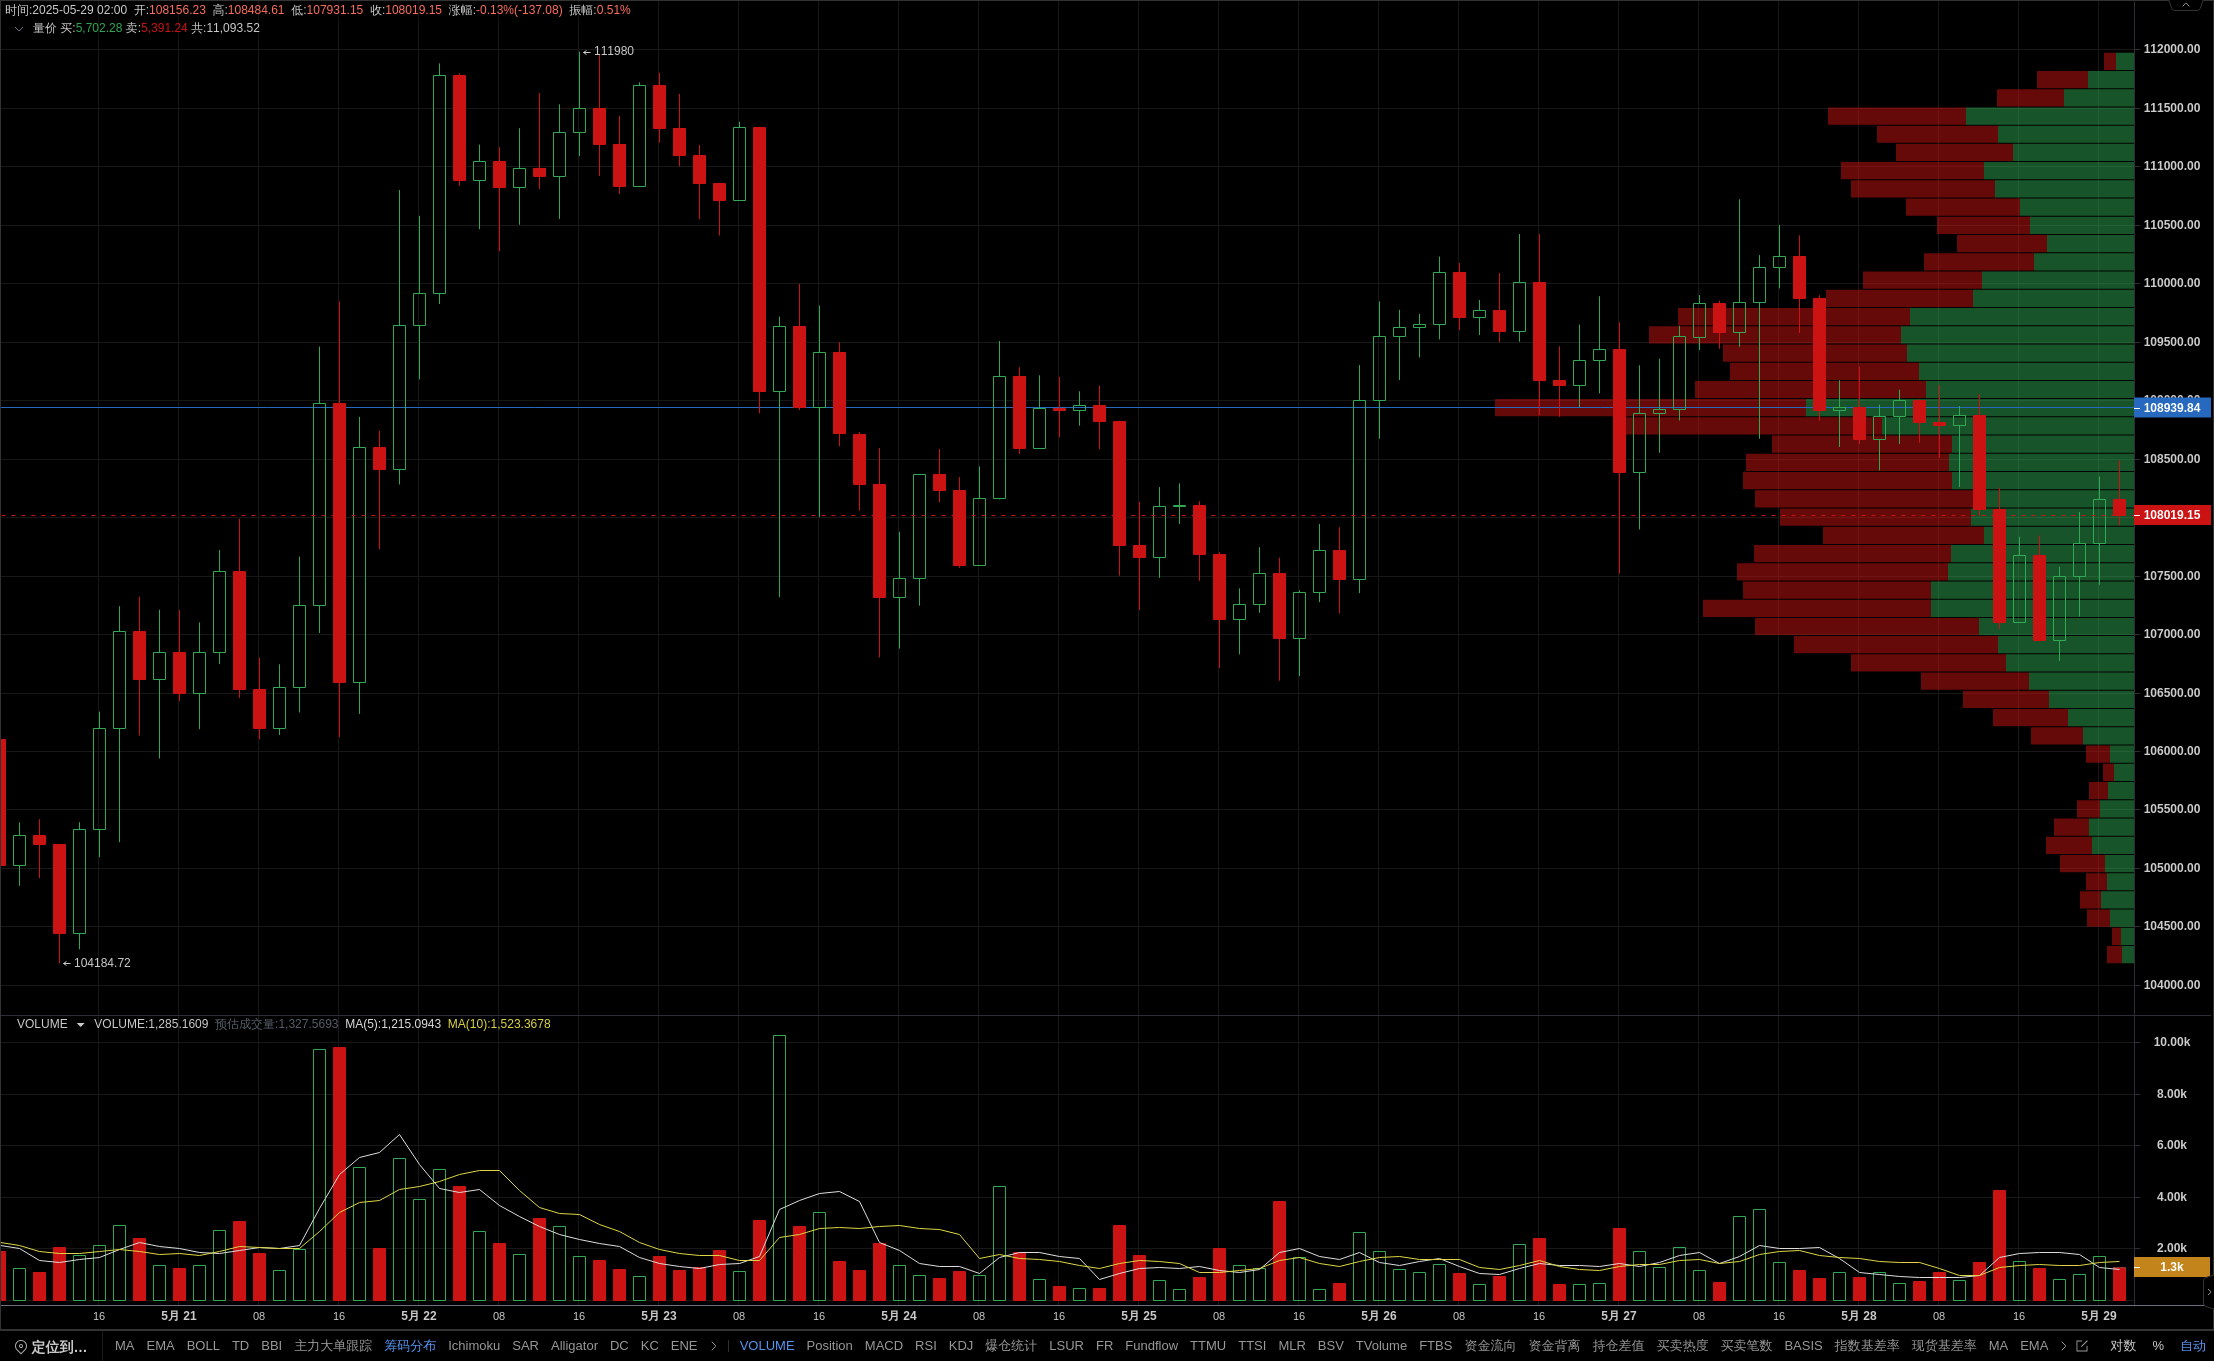
According to the membership indicator, the current price is below the EMA24/52 moving average, showing an overall downward trend. Based on the distribution of chips, the area between 107289 and 107488.5 forms a triple support, with a high concentration of buying, and prices are expected to stabilize and rebound in the short term. At the same time, the 10 day moving average of trading volume increased by 10.73%, indicating increased market activity and providing momentum for the rebound. On the candlestick chart, a red triad appeared in the 08:00 cycle, coupled with a KDJ golden cross signal, further verifying the possibility of a short-term rebound. However, there is significant resistance above 108886, and a breakthrough requires stronger buying support. The membership function helps you accurately capture support and resistance, quickly open membership, and plan ahead! The data is sourced from the PRO member's [BTC/USDT Binance 2-hour] candlestick, for reference only, and does not constitute any investment advice.