BTC Short term Key Node: Bottom Deviation or Triggering Rebound
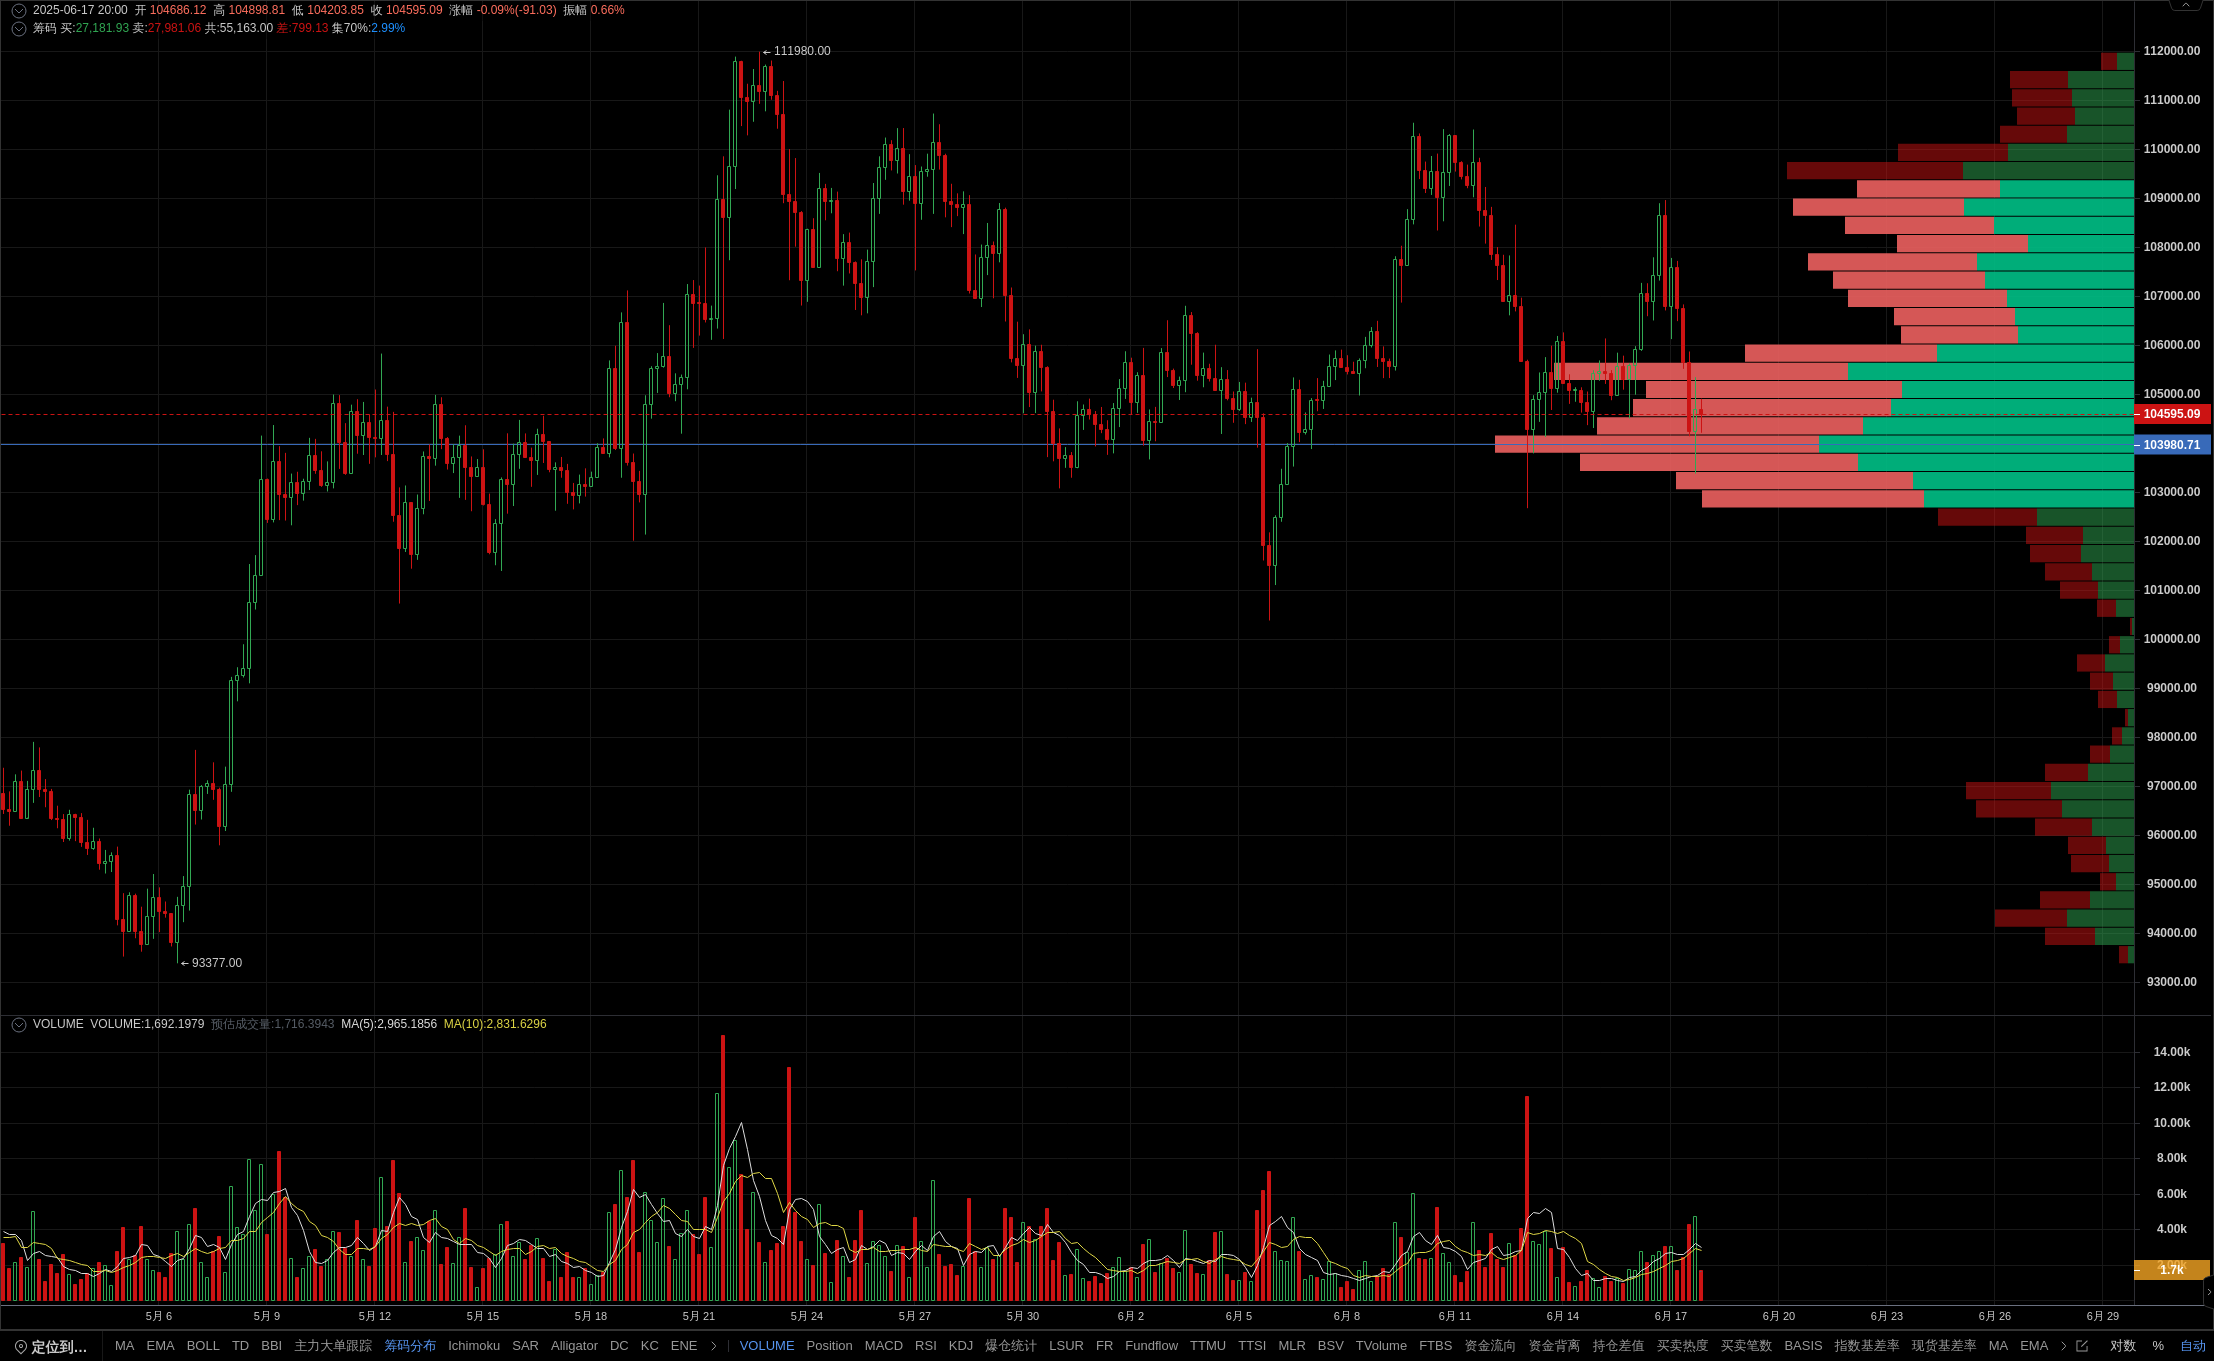
Member indicators show that the 4-hour cycle K-line forms a bottom pattern around $104200, combined with KDJ entering oversold areas, increasing the probability of short-term rebound. Meanwhile, the distribution of chips reveals that $105574 is a strong resistance level, and the price needs to break through here to confirm further upward movement. Although the MACD bar chart continues to shrink, the trading volume has significantly decreased, indicating a strong wait-and-see sentiment in the market. EMA24 and EMA52 are still in a bearish position, alert to the continued downward momentum. Open membership now and accurately capture the turning point of rebound! The data is sourced from the PRO member's [BTC/USDT Binance 4-hour] candlestick chart, for reference only, and does not constitute any investment advice.