Click on the link to enter the live stream: https://meeting.tencent.com/p/7890471408
Recently, the financial market has remained hot, and changes in tariff policies and upcoming non farm payroll data have become the focus of global investors' attention. These two may seem isolated, but they are closely related. Once they collide, the market will inevitably undergo tremendous changes.
Tariffs, as taxes levied by a country's customs on imported and exported goods, have a profound impact on international trade and the economy. Imposing tariffs will increase import costs and suppress imports; Lowering tariffs is the opposite. Different industries are affected differently by tariff adjustments, with the automotive and technology industries being typical examples.
Non farm employment data, which intuitively reflects the health status of the US economy, key information such as employment numbers, unemployment rates, and average hourly wages, is of great significance to the direction of the economy.
The interaction between the two can lead to an increase in tariffs, resulting in rising costs and declining profits for businesses, or triggering layoffs and impacting non farm payroll data; Non farm data also affects the direction of tariff policies. In the past, the market has shown that they can trigger financial market fluctuations, affecting the foreign exchange, stock, and gold markets.
It is worth mentioning that the cryptocurrency market is equally sensitive. The market uncertainty caused by tariffs and non farm payroll data will prompt some investors to turn to cryptocurrencies for new opportunities, driving price fluctuations. Its decentralized and safe haven characteristics are becoming increasingly prominent in complex market environments. Investors must closely monitor and adjust their investment strategies reasonably.
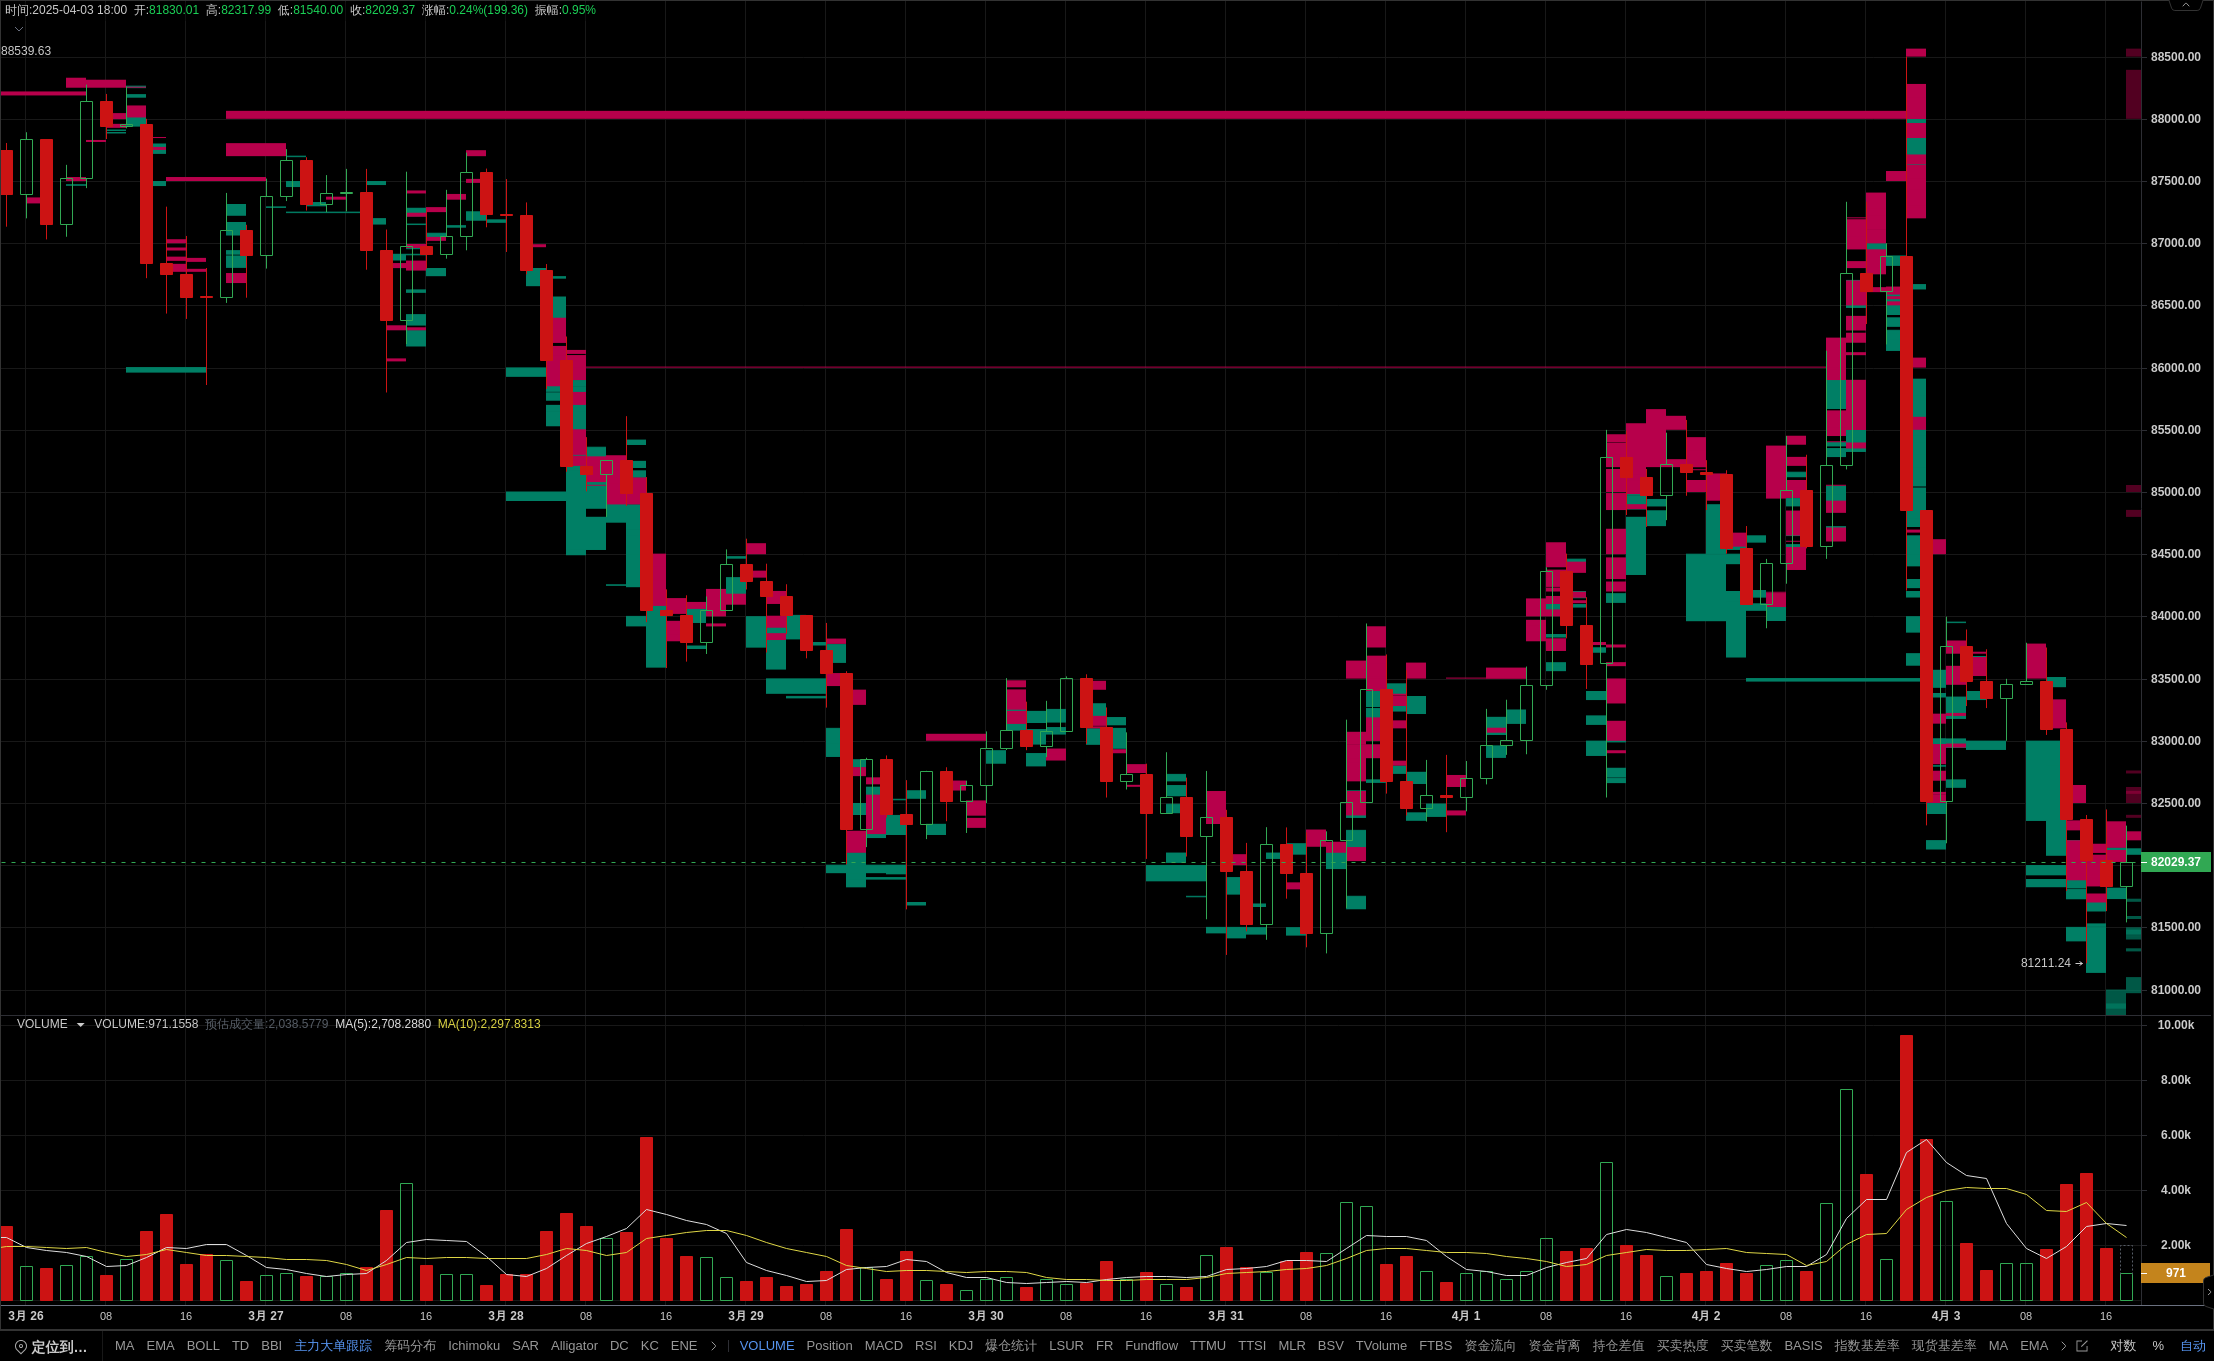
Accurate analysis of Bitcoin trends requires the combination of Bollinger Bands (BOLL), MACD, and naked candlesticks. Currently, Bitcoin is within the Bollinger Bands channel, with a mid track of $84000, firmly holding onto the bullish position above it. Conversely, the bearish position dominates, with the upper track of $88000 blocked and the lower track of $81000 supported. The channel may narrow or face a change in direction. In the MACD indicator, the DIF line and DEA line form a golden cross, and the bar line becomes longer on the zero axis, indicating a short-term upward trend. Looking at the naked K-day chart, there is often a long bearish candlestick with consecutive small bullish candlesticks, indicating a strong bullish trend. However, if there are large solid bearish candlesticks or multiple bearish candlesticks in the future, the trend may reverse, and investors still need to be cautious. How can I get there specifically?
Teacher Zhao Yun, who has 9 years of practical trading experience in the cryptocurrency industry, will provide a detailed breakdown for everyone. Welcome to the live broadcast room to check in!
Join the Three Kingdoms College Exchange Group to receive more services:
1. Real time troubleshooting (online one-on-one question answering and sorting)
2. Professional technical analysis and theoretical learning
3. Construction and improvement of trading system
4. Live streaming courses every day, contract termination, real-time order making, to help you successfully land!
Official QQ group: 579358784
Tencent Meeting ID: 789-047-1408 The live broadcast room will be broken down in detail.
Disclaimer: The above content only represents the author's personal opinion and is for communication and sharing purposes only. It does not represent the position or viewpoint of AiCoin and does not constitute any investment advice. Based on this investment, there may be external contacts, which have nothing to do with AiCoin, and the consequences shall be borne by oneself.
