Loading...
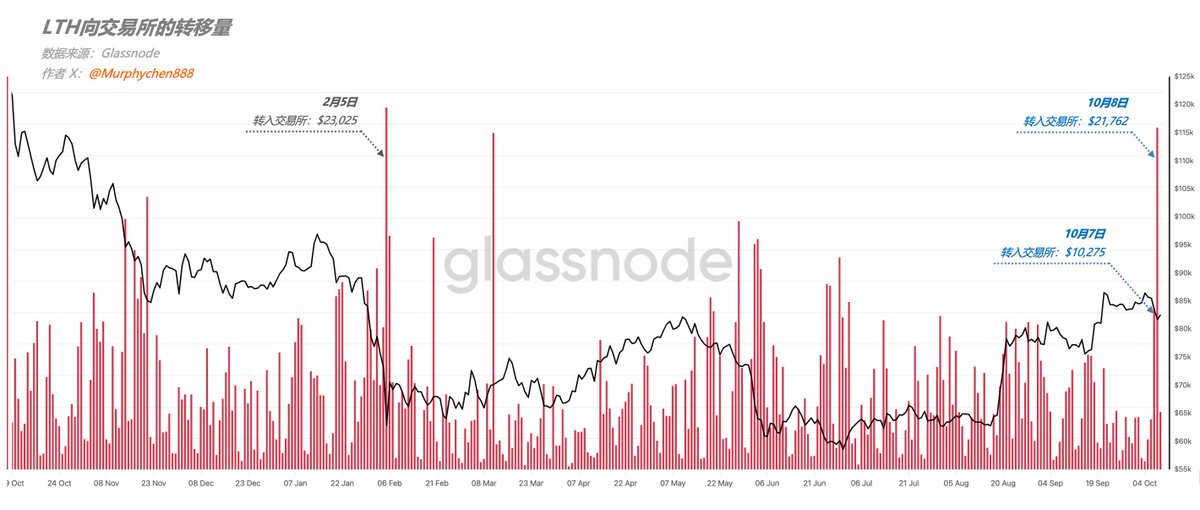
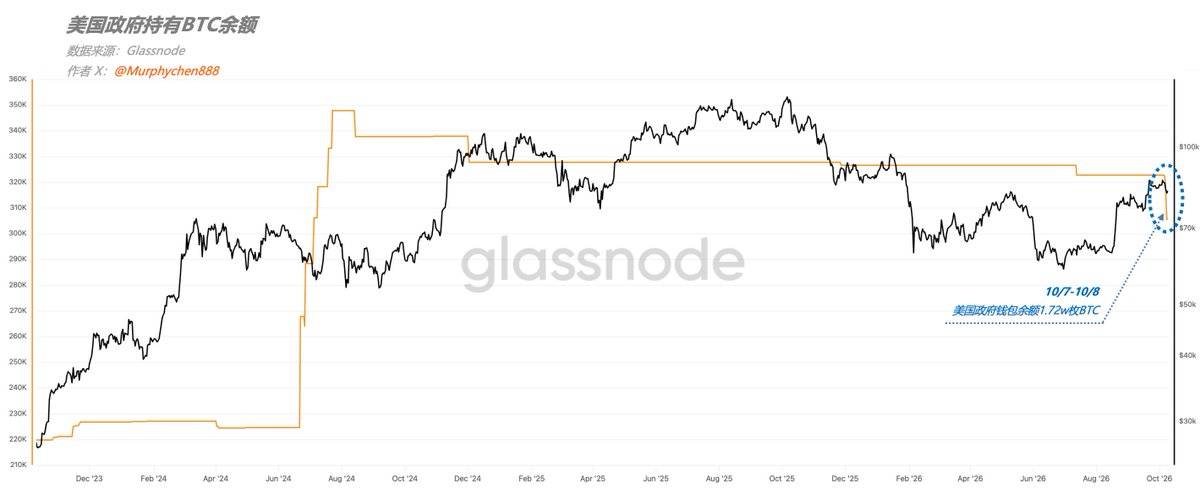
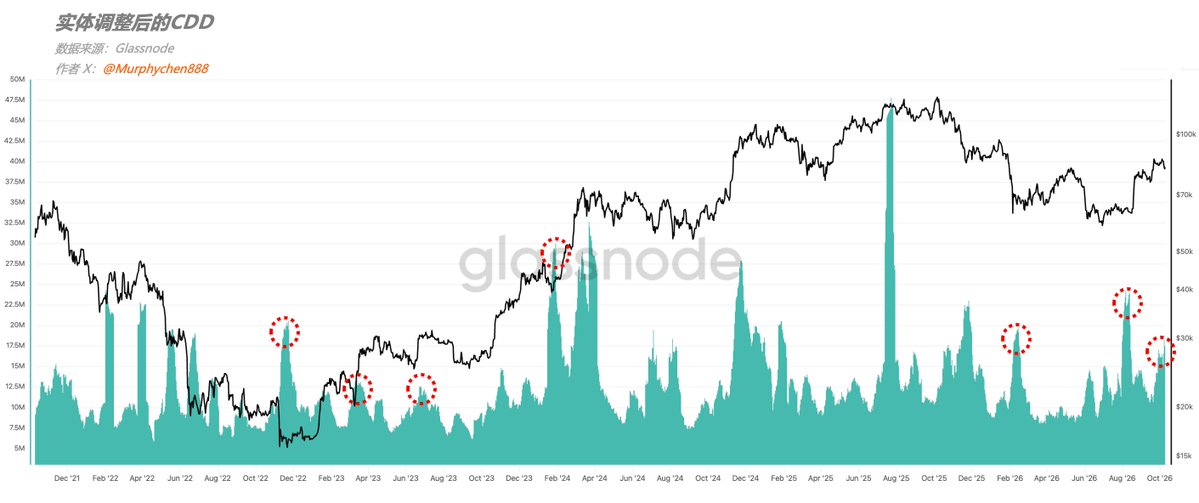
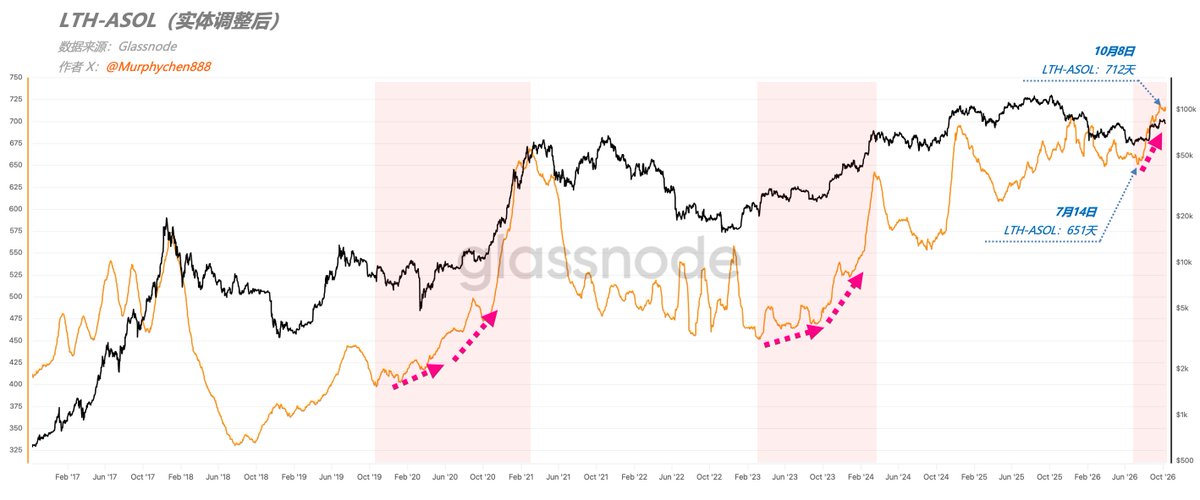
This is the real distribution! But it's not that scary either. Data shows that long-term holders (LTH) have cumulatively transferred approximately 3.2w BTC to the exchange from October 7th to 8th. This is the second largest daily LTH conversion scale since the sharp decline on February 5th this year (Figure 1). If these chips are not used for margin on currency based contracts (in fact, OI has not increased so much), then it is likely a potential selling intention. However, these 3.2w BTC cannot all be considered as active distribution by LTH. Because during the same period, the US government related wallets transferred approximately 17200 BTC (aged 1-2 years) to Coinbase Prime. Considering that Coinbase Prime is an official custodian and trading service provider designated by the US Marshals Service, this transfer does not necessarily imply a sale and may also be related to asset custody integration or case resolution (Figure 2). After excluding this special transfer, the remaining potential selling pressure that we need to pay more attention to is about 1.48 million coins, mainly from long-term chips with a coin age of 6-12 months and 3-5 years. During the bear bull transition period, LTH transfers 2000-3000 BTC to the exchange daily, which is usually within the normal range. Once the transfer volume suddenly exceeds the mean significantly, it is often accompanied by special events or expected bearish trends. But the question is, is' market downturn+LTH chip distribution 'necessarily a bad thing? I don't think so! Especially during the transition period between bear and bull. From the adjusted CDD (Coin Day Destruction Volume) data of the entity, whenever the market rebounds and CDD rises significantly (Figure 3), it often means that some long dormant chips have become active and even choose to leave. The calculation method of CDD is to multiply the amount of BTC spent by the number of holding days, so the surge in CDD indicates that a large amount of "old coins" have been spent But in hindsight, although the decline brought short-term selling pressure, it also prompted some undecided chips to switch hands. The early release of potential selling orders actually reduces resistance for subsequent market trends. If the observation period is extended, this phenomenon becomes easier to understand. In the complete bull market process, as prices continue to rise, more and more chips held for longer periods of time will gradually join the issuance column. This change usually drives the LTH-ASOL (Long Term Holders who have already spent an output of average coin age) curve to gradually rise (Figure 4). Because as the proportion of old chips spent increases, the overall average coin age also increases. For example, on October 8th, the average age of LTH chips spent reached 712 days, while on July 14th it was only 651 days. This means that the long-term chips involved in on chain transfer are showing more obvious aging characteristics. From another perspective, this is also a manifestation of the long-term accumulation of chips being gradually activated and the increasing activity of turnover during the bull market process. So, we don't need to worry excessively about every LTH distribution. What is truly worth paying attention to is whether these chips can be effectively accepted by the market. After all, a bull market cannot have only buying without selling. The continuous release of old chips and the continuous acquisition of new funds is itself a process of market value rediscovery. As long as demand can effectively digest supply, phased distribution cannot become an obstacle to the trend. Adequate chip turnover is actually an important foundation for a market to go further.