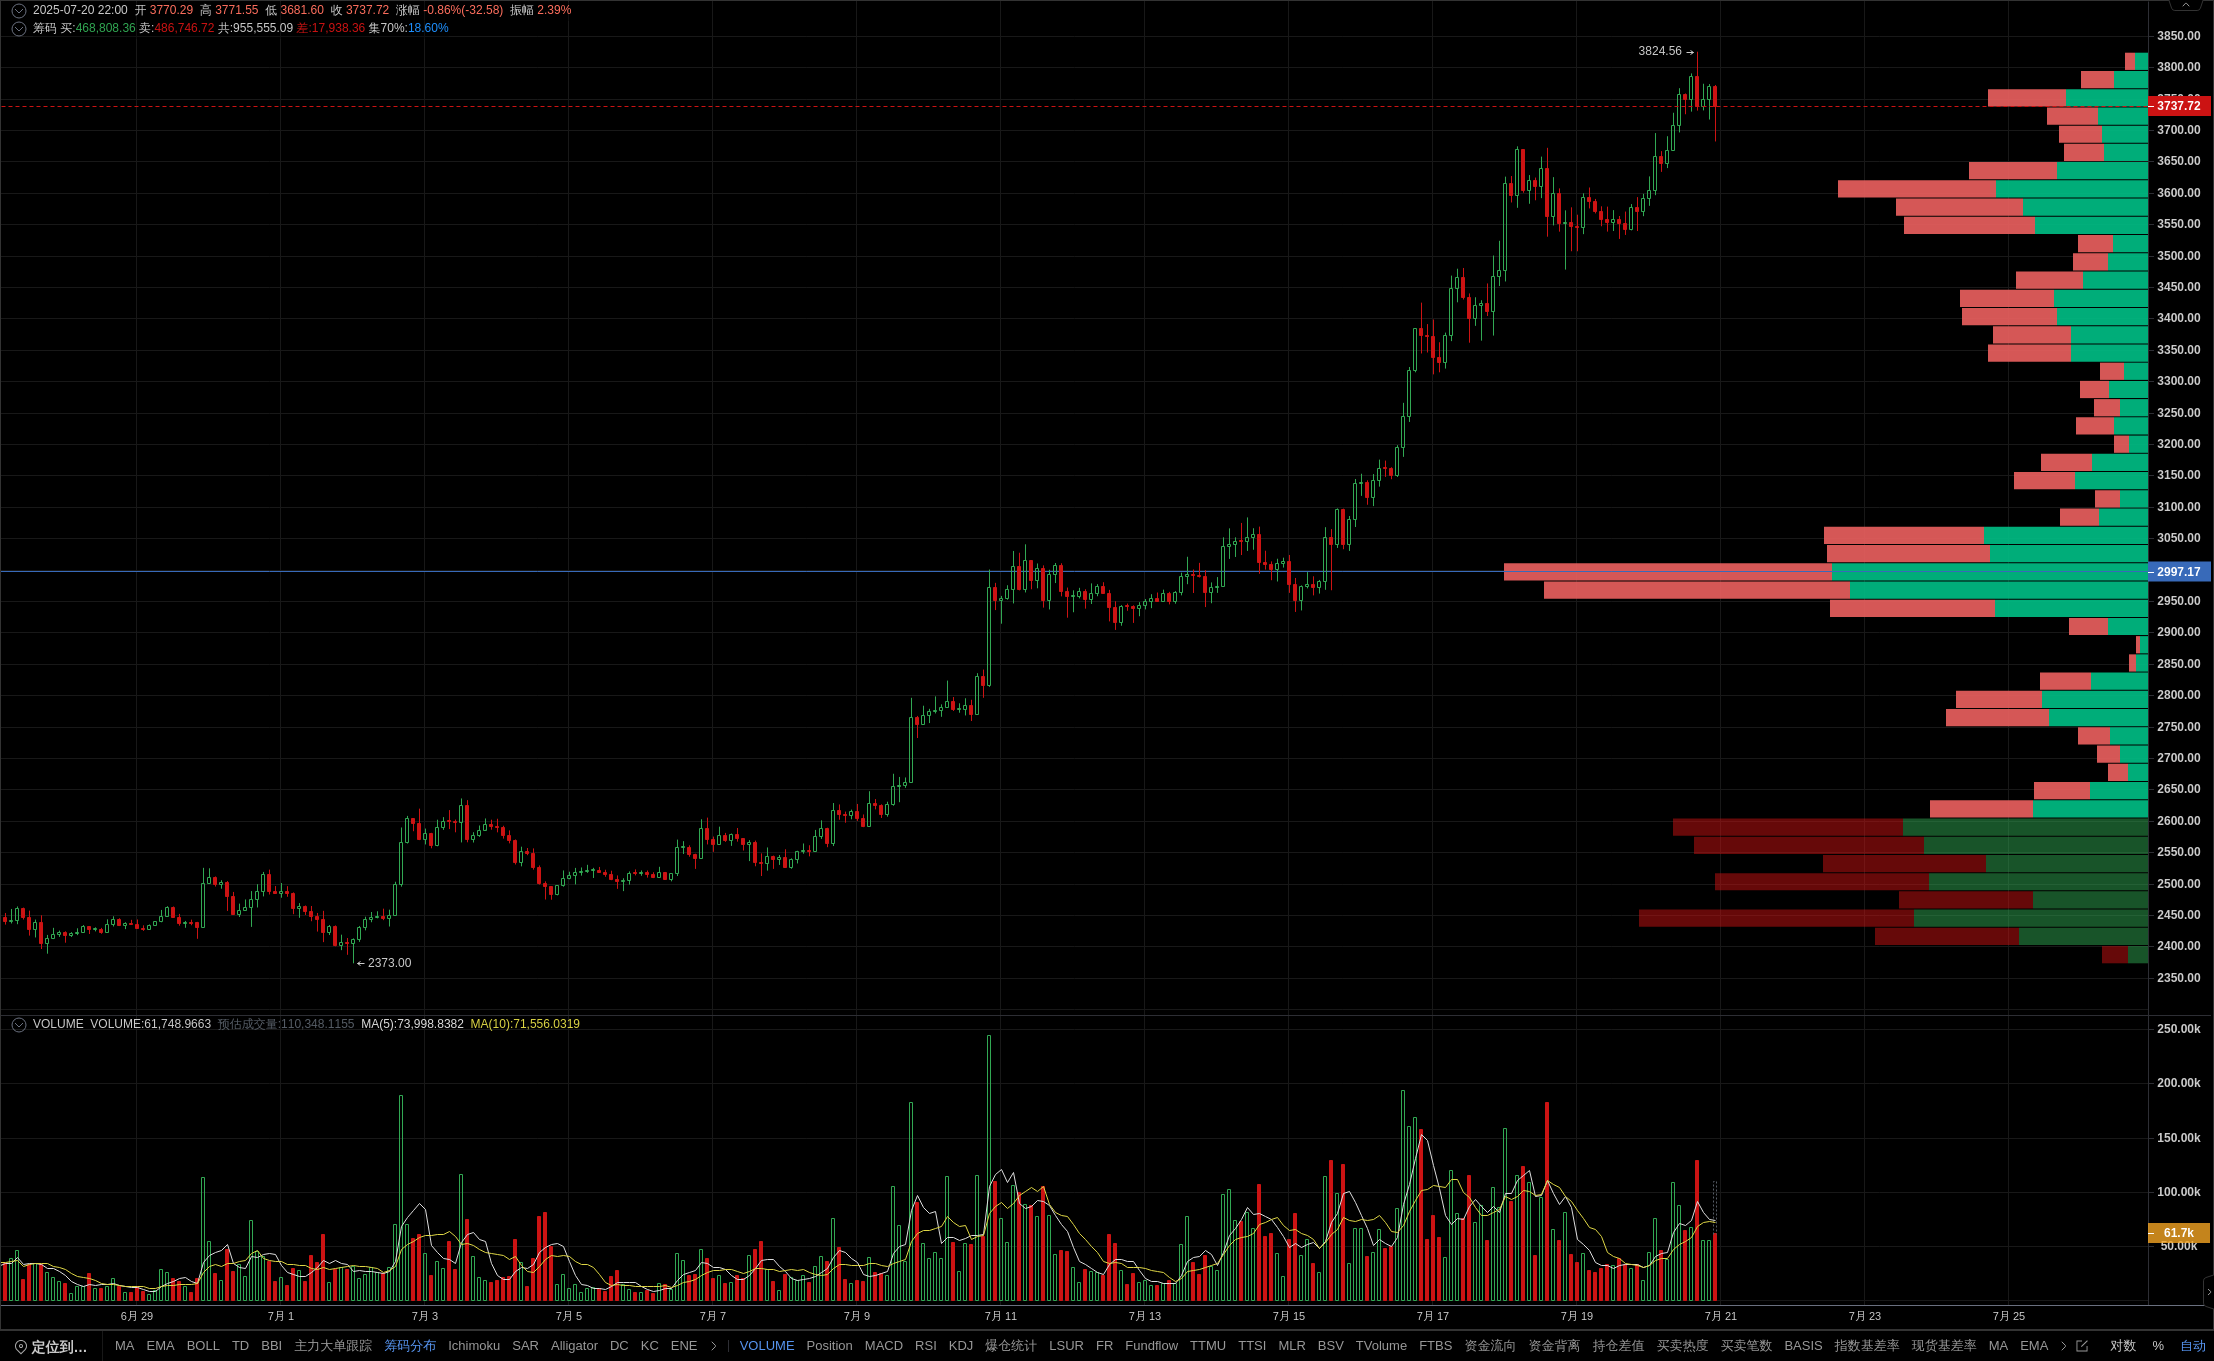
On July 22nd, according to 4E observations, the global cryptocurrency industry is entering a deep water period of synchronized evolution of policies, capital, and market structure. Institutional holdings have reached new highs, stablecoins have expanded, and top projects have launched IPOs, highlighting that the industry is entering a new round of mainstream integration cycle.
According to the latest data from Bitwise, 46 new listed companies will purchase Bitcoin in the second quarter of 2025. The total holdings of these companies have reached 847000 BTC, accounting for 4.03% of the total Bitcoin supply, with a total market value of 91 billion US dollars. This reflects that institutions are continuing to strategically layout their cryptocurrency assets.
At the same time, Bullish, incubated by Silicon Valley investor Peter Thiel and owning exchange and media businesses, has officially submitted an IPO application to the SEC and plans to list on the New York Stock Exchange. This will be another cryptocurrency unicorn to go public in the United States after Coinbase, marking a further strengthening of the integration trend between the primary and secondary markets.
At the policy level, the White House is expected to release its first cryptocurrency policy report on July 22, and US Treasury Secretary Benson also publicly stated that "the US dollar is about to go live," affirming that the GENIUS bill will solidify the dominant position of the US dollar in the new financial system. Federal Reserve Chairman Powell and European Central Bank President Lagarde will both deliver speeches this week, with market attention focused on their responses to tariffs, interest rates, and digital asset regulatory positions.
In addition, the seasonal index of altcoins has risen to 52, indicating that over half of the top 100 cryptocurrency assets have outperformed BTC in the past 90 days, and market risk appetite has significantly increased. However, according to Santiment data, Bitcoin social media discussions account for over 43%, and analysts remind us to be cautious of the short-term pullback risk caused by emotional overheating.
4E reminds investors that although the mainstream process is promising, market sentiment still needs to be judged calmly, avoiding blindly chasing high prices and rationally evaluating the risk and return structure.
