Loading...
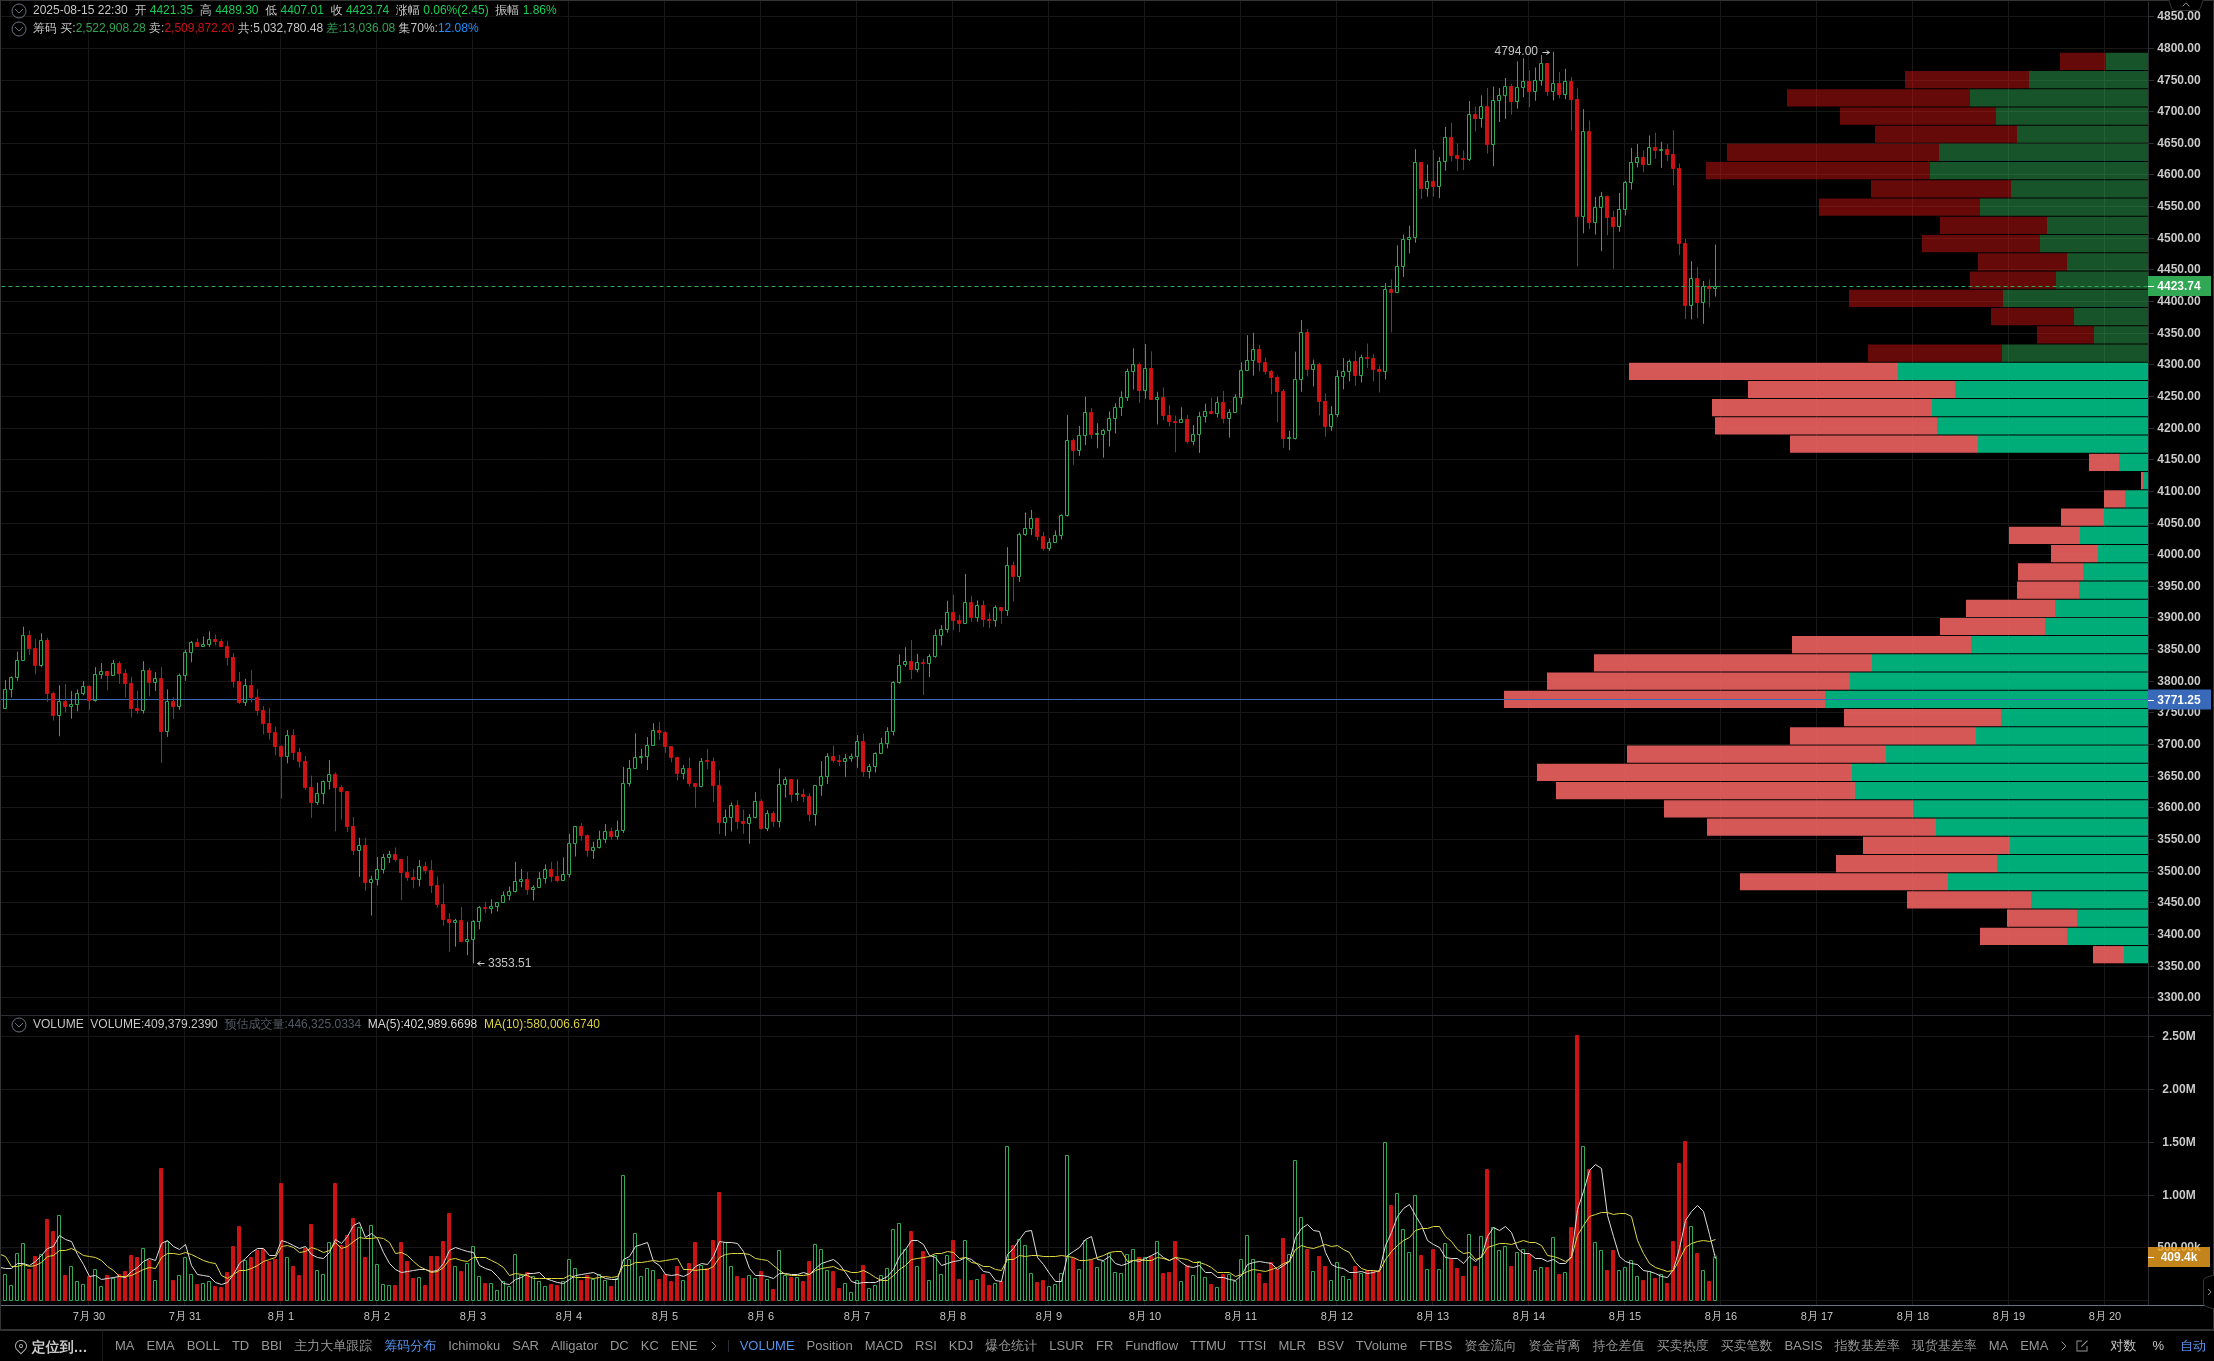
Member indicators show that the 90 minute K-line closed with a cross, with prices running below EMA24 and EMA52, and EMA24 crossing EMA52 to form a dead cross, indicating that bears are still dominant. At the same time, the distribution of chips shows that the maximum trading volume is concentrated in the range of 4285-4303, and the current price is far away from this support, further verifying the downside risk. It is worth noting that although the RSI double bottom pattern and KDJ golden cross suggest a possible rebound, the trading volume of the 20 day moving average has decreased by 34.23%, indicating insufficient buying momentum and the rebound may be difficult to sustain. Open membership immediately, accurately capture key trends, and seize market opportunities! The data is sourced from the PRO member's [ETH/USDT Binance USDT perpetual 90 minute] candlestick, for reference only, and does not constitute any investment advice.
