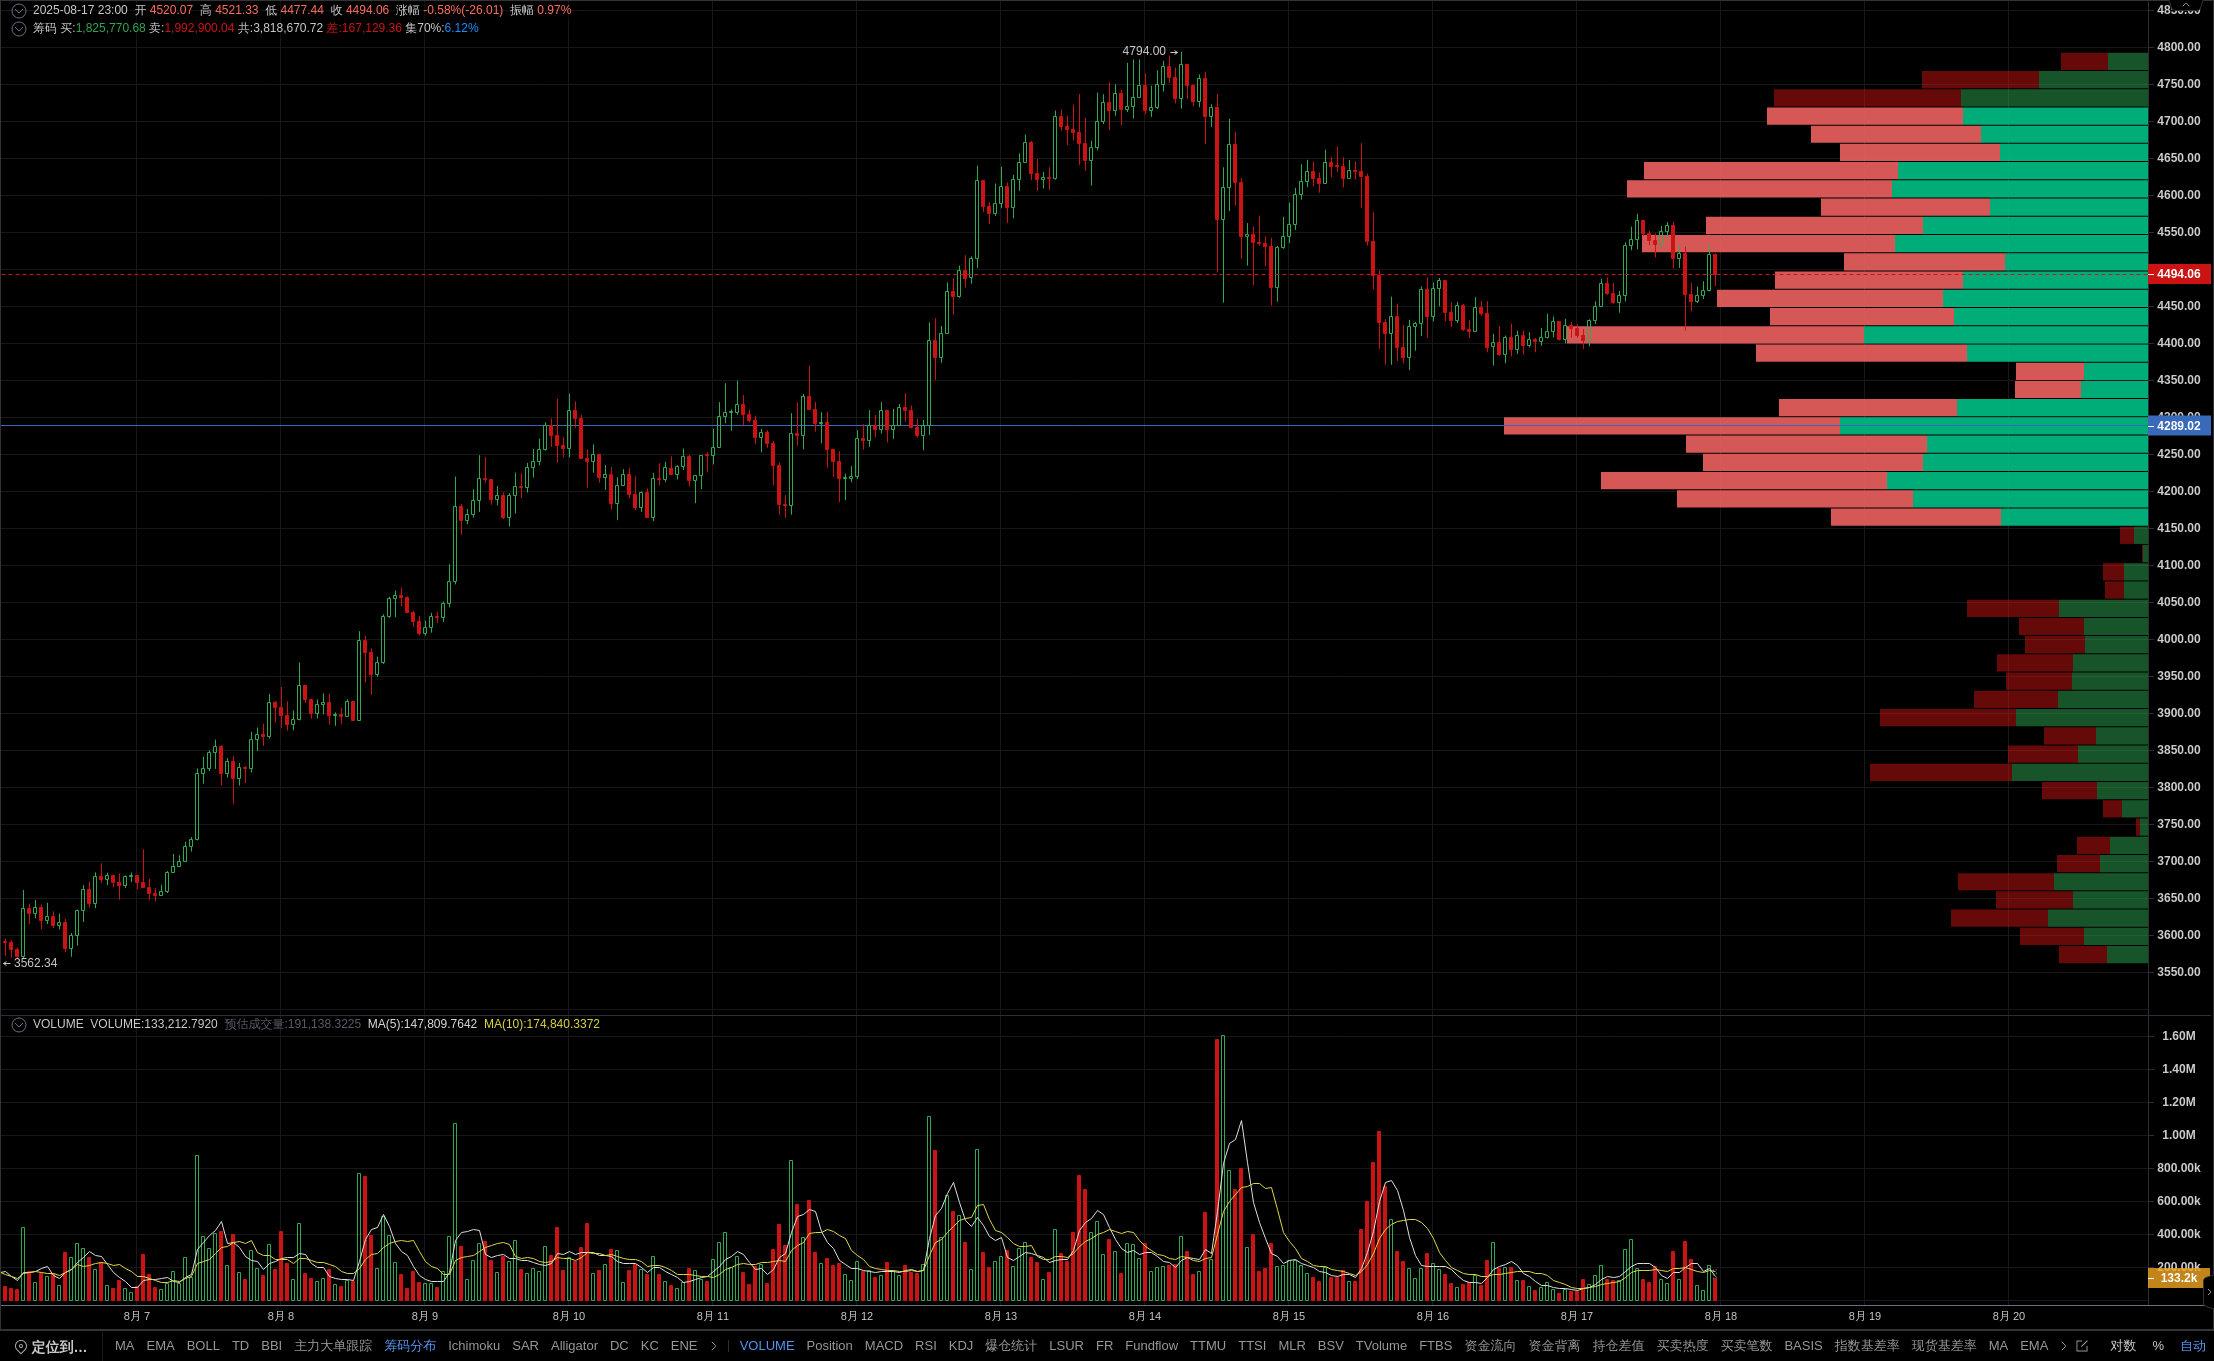
ETH Key Resistance Test: Chip Distribution Reveals Potential Breakthrough Opportunities
The current price of $4494 is above the EMA24/52 moving average, indicating a strong overall trend. However, the latest 1-hour cycle K-line has formed a top split pattern, superimposed with a waist belt pattern, indicating an increase in short-term upward pressure. The distribution of chips shows that the $4529-4552 range is a strong resistance area with dense cumulative trading volume, and a breakthrough requires continuous volume support. Although RSI has broken through the 50 median line and is moving upwards, KDJ remains stagnant at a high level, indicating that the upward momentum may be depleted. If it effectively breaks through $4552, the next target will point to $4621; On the contrary, if it falls under pressure, the lower support will reach $4414. Member indicators accurately capture resistance levels, helping you seize breakthrough opportunities! The data is sourced from the PRO member's [ETH/USDT Binance USDT Perpetual 1-hour] K-line, for reference only, and does not constitute any investment advice.
