Loading...
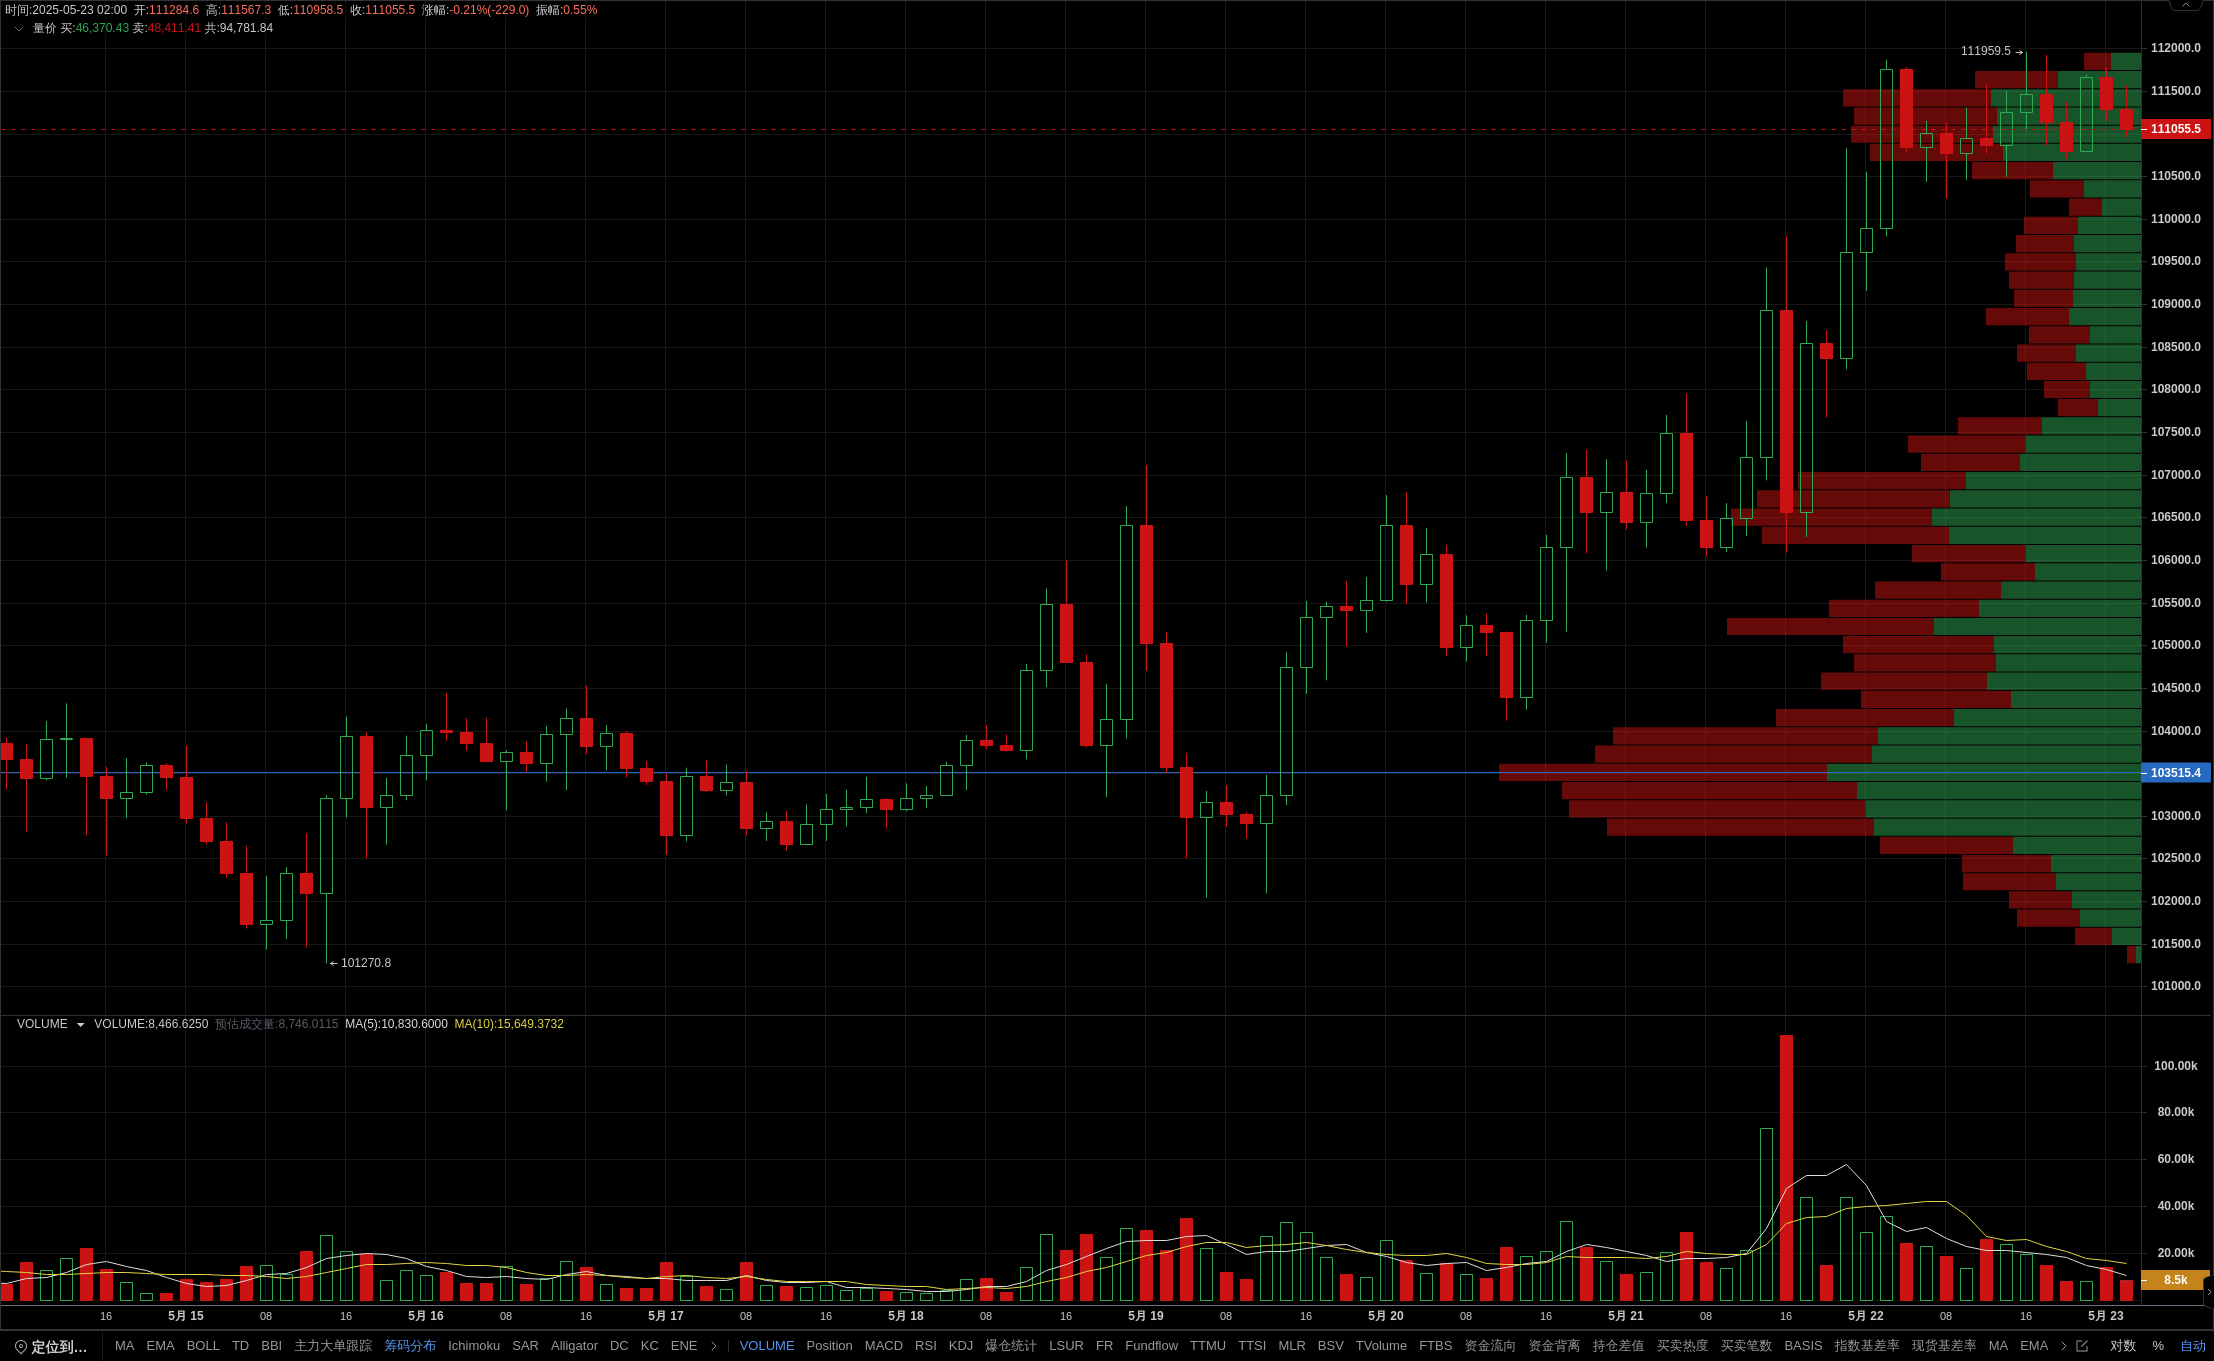
Membership indicators show that the current trading volume is extremely shrinking, with a short-term average decrease of 31.71% and a significant weakening of market activity. Combined with the K-line pattern, a top split pattern appeared in the 2-hour morning cycle, and the MACD bar chart continued to decrease. The downward momentum is strengthening, and the risk of short-term correction is increasing. Upon further observation, although the price is above the EMA24/52 moving average, the convergence of the KDJ indicator suggests that the current upward trend may weaken. The key support is at $111000, and if it falls below, it may test $110500. Unlock member indicators, accurately capture key trends, and stay ahead to grasp turning points! The data is sourced from the PRO member's [BTC/USDT Binance USDT perpetual 2-hour] candlestick, for reference only, and does not constitute any investment advice.