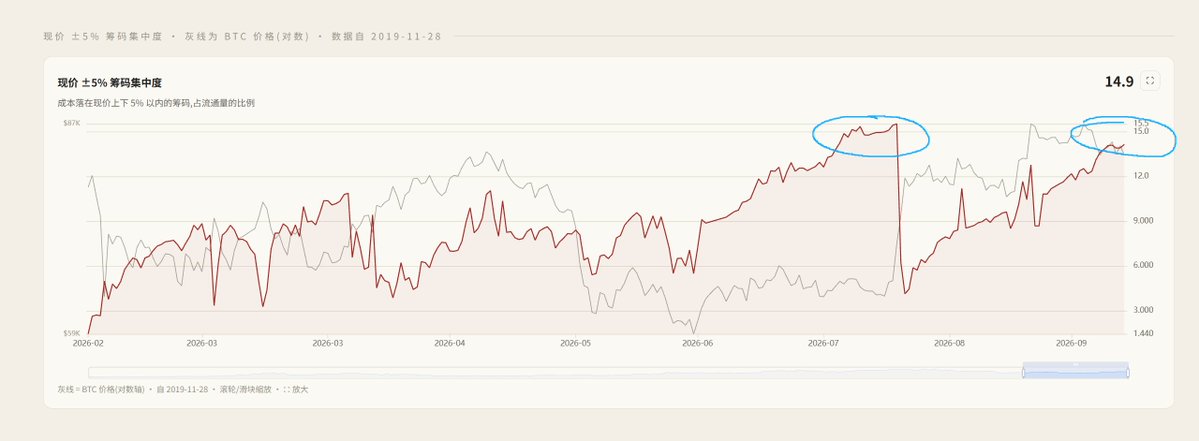
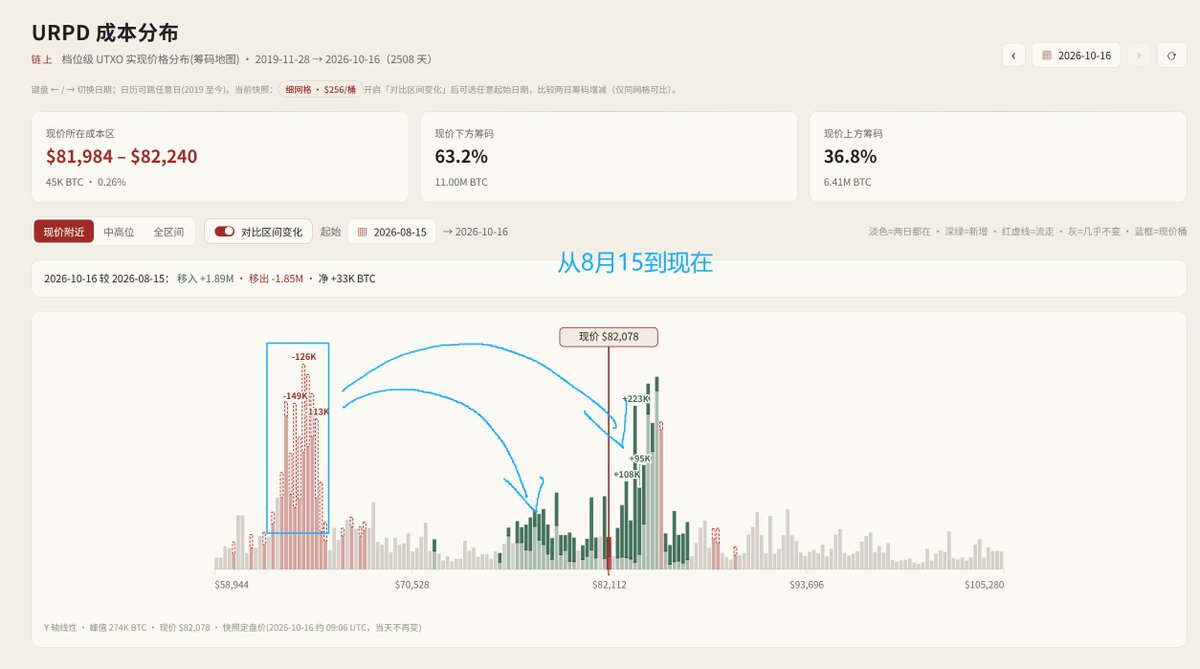
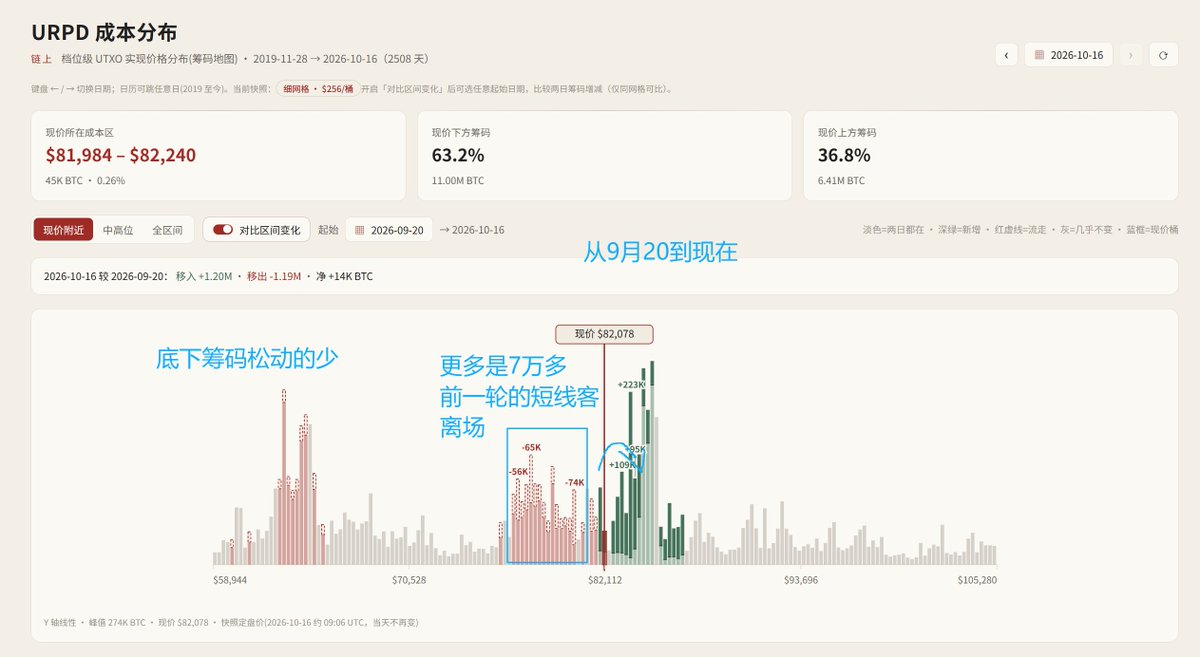
The concentration of Mo Da's chips has reached around 15% again (Figure 1) After reaching around 15% in the previous wave, it continued to sideways for 11 days . Take a look at the specific distribution of chips From the eve of the launch in mid August (when the previous wave of chips concentrated at 15%) to mid September, about 720000 chips with a value of over 60000 were moved away, and most of them completed turnover within 10 days after the rally in August after reaching 70000 (which can be regarded as short-term profit taking). (Figure 2) However, from mid September to the current second round, only 180000 chips were missing from the 60000 chips, and the main ones that changed hands were those bought in September for 76000-80000, which were then moved to 82000-88000. (Figure 3) Overall, in this current wave, the batch with a bottom price of 6W has not sold much. The old-fashioned stocks with 8W8 and above have also cut a small wave in this range, and short-term customers who bought more than 7W have also sold here. Everyone is pushing towards the middle, which is now the source of another concentration of 15%. ------------ The concentration of chips is high, and there will be significant fluctuations in the future, but the direction of the fluctuations is uncertain . But the direction of departure is likely to be in the last two weeks of October. Starting from October 21st, major US stock giants will begin to release their financial reports (10.21 Meta, TSLA | 10.28 GOOGL, MSFT | 10.29 MSTR,AMZN ,COIN | 11.02 AAPL) At the FOMC meeting on October 28th, PCE+GDP will be held on October 29th At present, there is a high probability that there will be no interest rate hike in October, and it is predicted that the market will only give less than 15% (down from nearly 40% after CPI) The FOMC in October mainly looks at the attitude towards December after the meeting (now priced at 74% for December) And whether there has been any improvement in liquidity after FOMC. -------------- The data is very contradictory now In the short term, there is no new capital entering the ETF, with a outflow of 450 million in 7 days. Macro still facing headwinds, with 10-year US Treasury bonds still above 5% The price is at the bottom of the box in October, with a bunch of buyers around 8w4 being covered . But in the medium to long term The medium to long term trend is not bad, still above the holding cost for short-term investors (currently around 7W4). The bottom position of over 60000 did not loosen during the October wave, and there was no selling pressure from additional bottom chips. -------------- So now it's impossible to determine what to do next. Any change in conditions will guide the market. Conditions for going down: FOMC releases eagle in October, probability of interest rate hike in December surges to over 90%+pessimistic financial reports from giants, US stocks continue to fall+ETFs continue to flow out Several scenarios, The daily closing price fell below 8W, breaking the box above and returning to the box below in September, indicating a weakening of the short-term trend If it falls below 7W6/7W4 (September bottom+short-term customer cost), short-term customers will overall turn losses, which is generally seen as the boundary between short-term bull and bear on the chain . ---- Upward conditions: FOMC neutral to dovish, with a probability of falling below 50% in December+financial reports supporting US stocks+continuous net inflows from ETFs+improved macro liquidity Several scenes Retract 8W45, short-term trend turning bullish (the long short boundary of the October box) Stand above 8W7 (October high), confirm upwards, first look at 9W, then look at 9W5 ------------ If neither side is satisfied, continue grinding and wait for the next catalyst ...