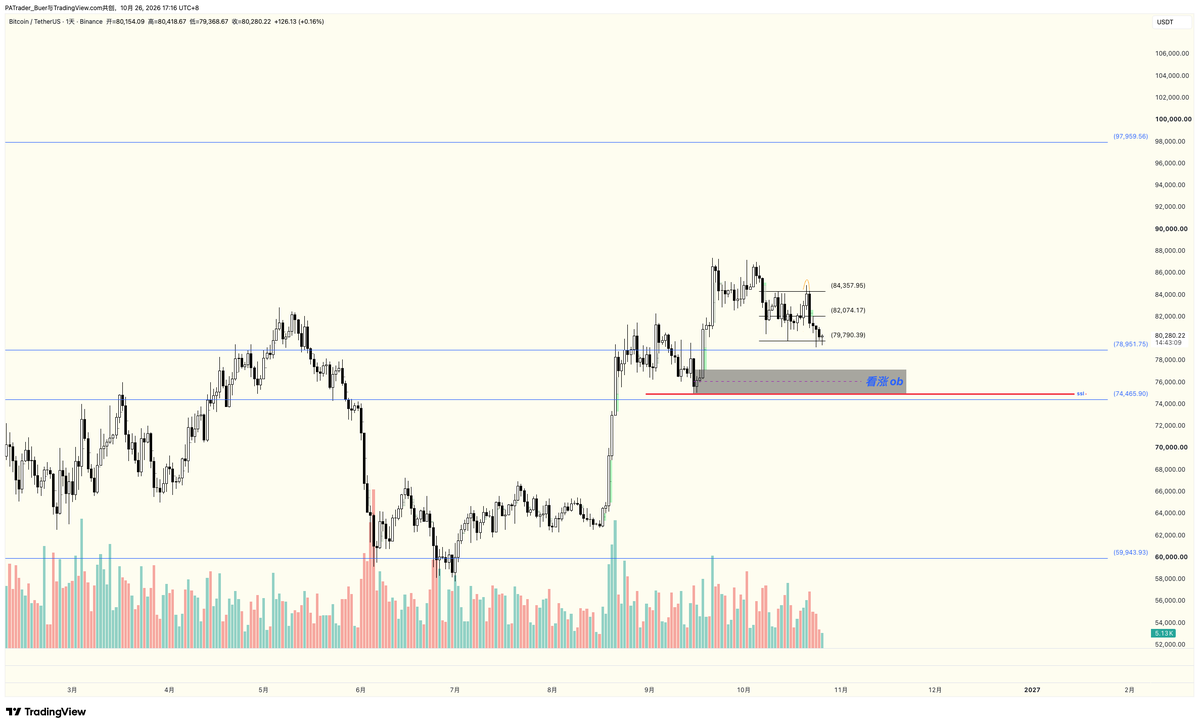
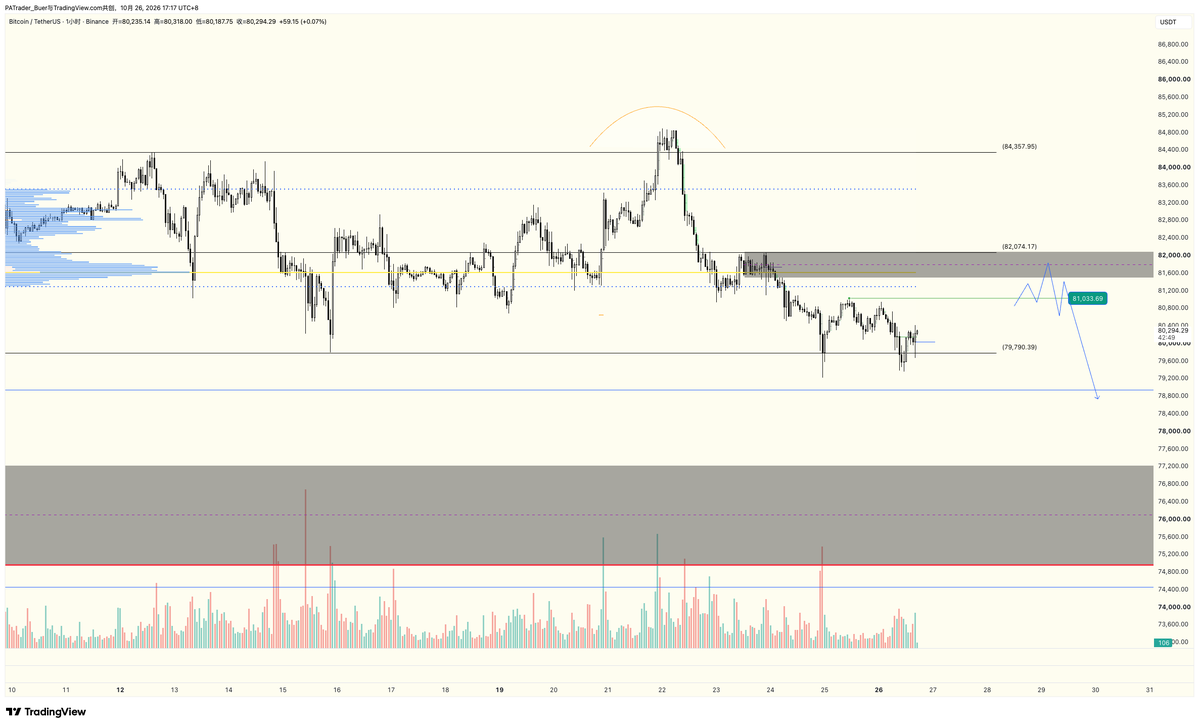
Parr BTC Market Daily Report - October 27 I. Daily Chart 1. The daily chart shows a range-bound movement between 798 and 843, but the current trend is downward. 2. We can see that after a brief upward move to 843 last week, the price fell continuously, directly hitting 791. 3. Today, after testing lower levels again, the price did not break the new low. Pay attention to a short-term rebound test, with the initial target around 82 (eq). II. Hourly Chart 1. Currently, the hourly chart is still in a downtrend. This looks like a second test, but we need to wait and see. 2. Currently, we need to pay attention to two levels above: 81 and 821. I suggest that if you are holding a short position, place your stop-loss at 821. If you want to short, also place your stop-loss at 821. 3. There is a probability of a breakout at the 81 level, as there is a significant amount of liquidity accumulated there. Furthermore, the current pullback in crude oil and rebound in US stock futures are noteworthy. If this trend continues at the open, it could push BTC upwards. This is an expectation, not a 100% confirmed trading action. Feel free to join our group for real-time market updates.