Designing trading strategies used to require coding, which had a high barrier to entry. Now, with the "visual scripting" feature, you don't need to know programming; you can create professional trading strategies just by dragging and dropping like building blocks, and you can also set K-line displays and trading alerts!
1. What is "Visual Scripting"?
In simple terms, it is a WYSIWYG (What You See Is What You Get) tool. Whatever functionality you want, you can directly drag and set it on the interface, and the system will automatically generate complex trading strategies for you.
Advantages:
Zero Code Barrier: No need to learn programming languages.
Professionalism: The generated strategies are still professional and effective.
Scalable: If you want to delve deeper in the future, you can directly modify the code based on the visual generation (the platform provides a self-developed language), achieving a smooth transition.
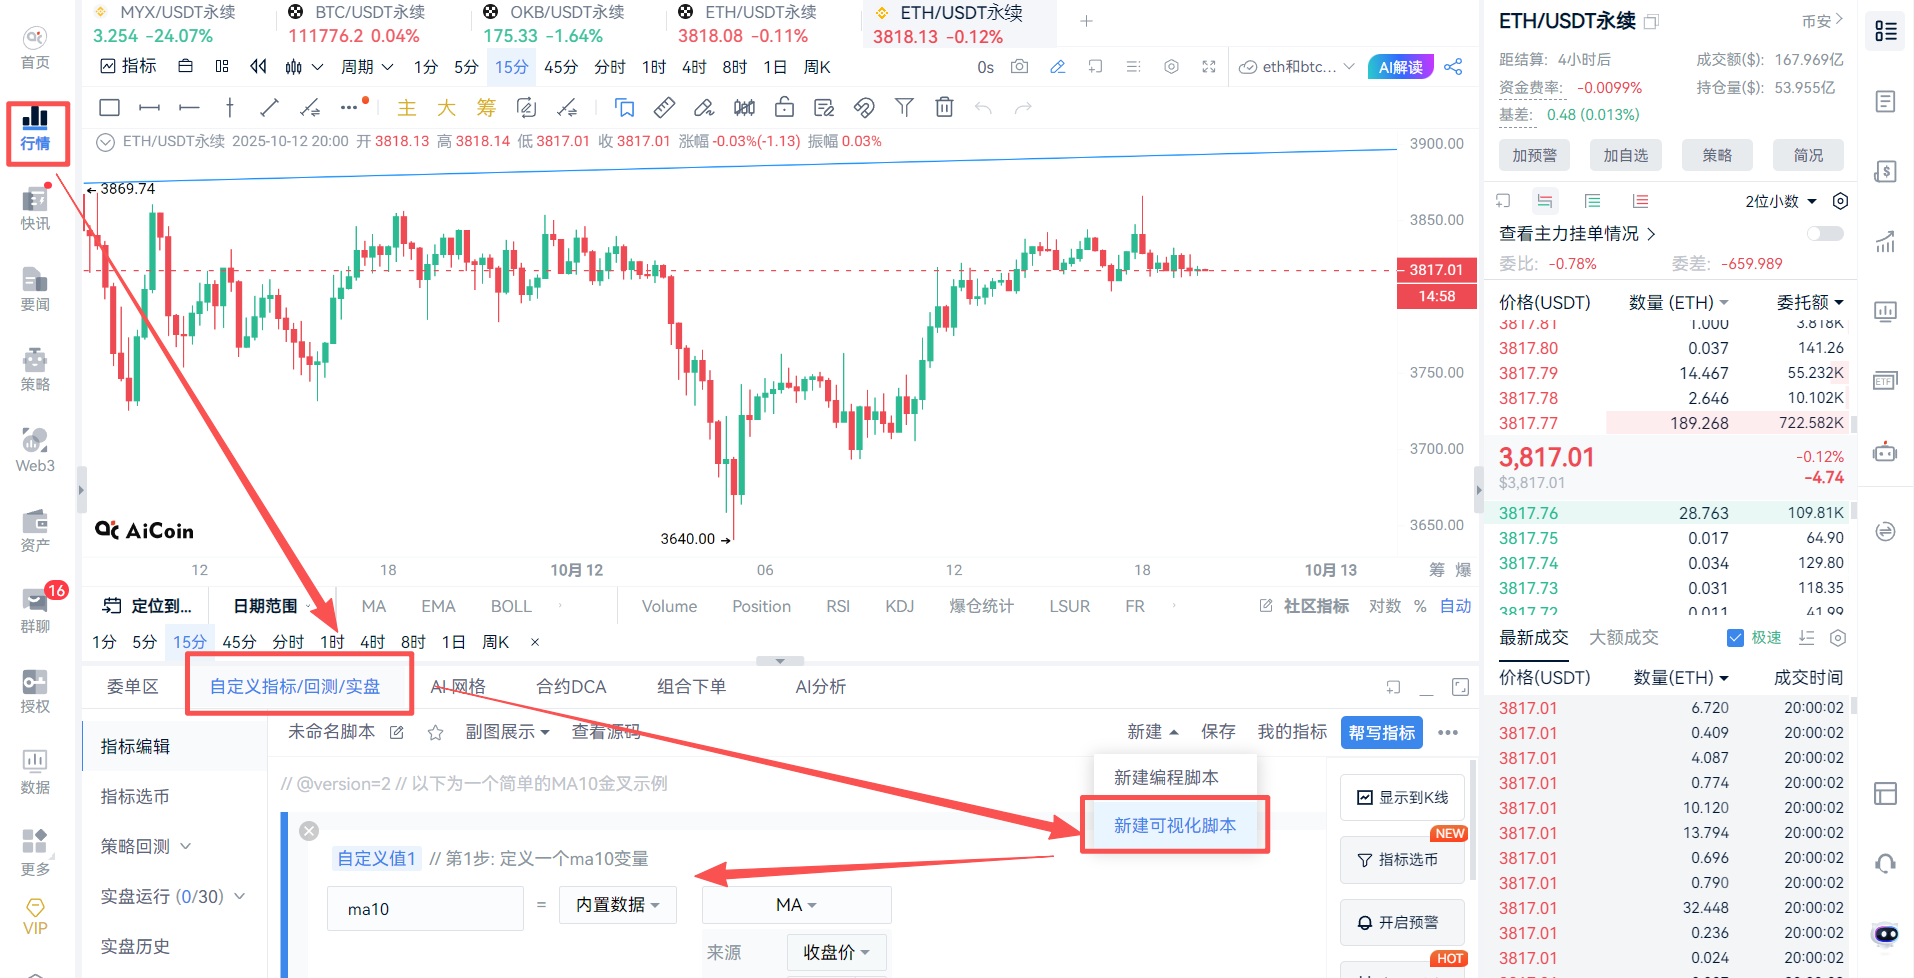
2. Easily Generate Trading Strategies in Four Steps (Using Moving Averages as an Example)
Taking the most commonly used "Moving Average Bullish Strategy" (i.e., "Golden Cross" buy signal) as an example, we will teach you how to complete strategy creation in four steps:
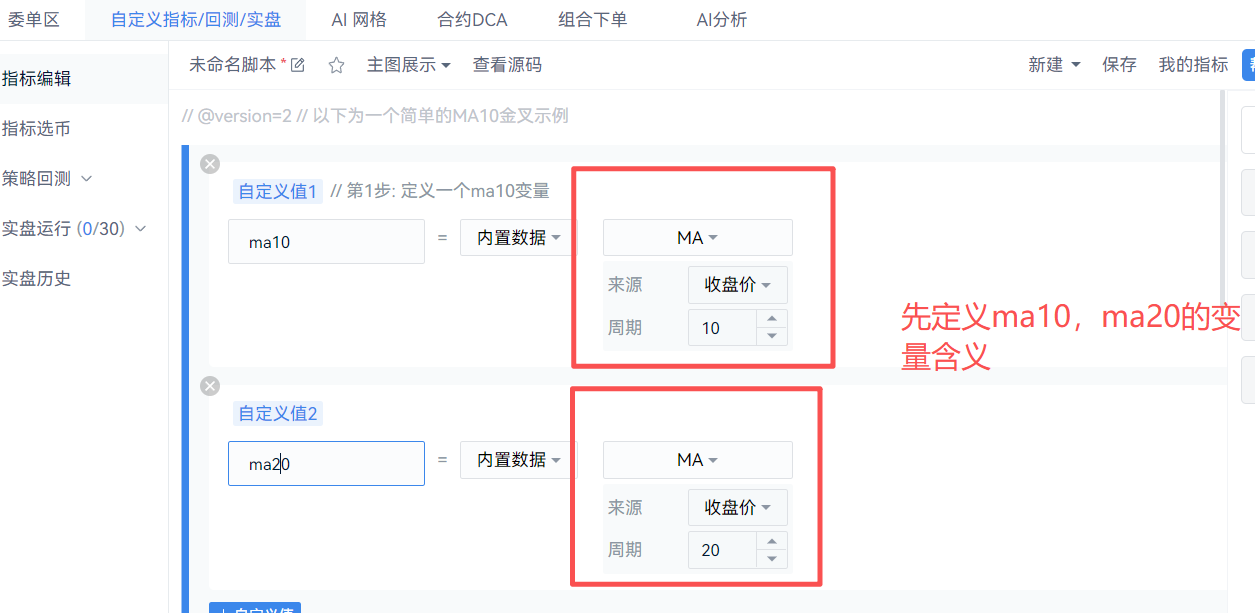
(1) Define Indicators: For example, set two moving averages: MA10 (10-day moving average) and MA20 (20-day moving average).
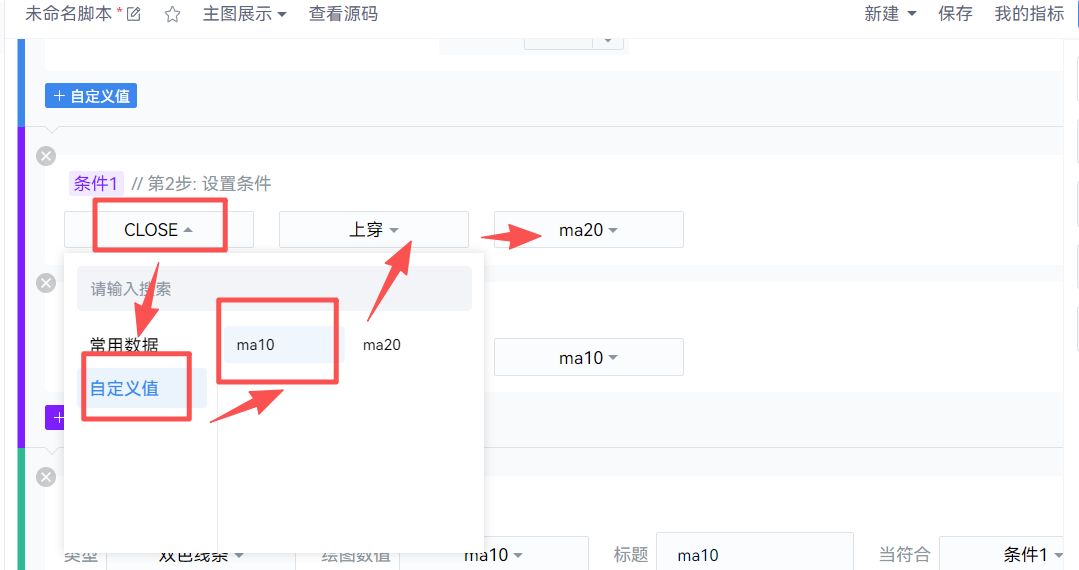
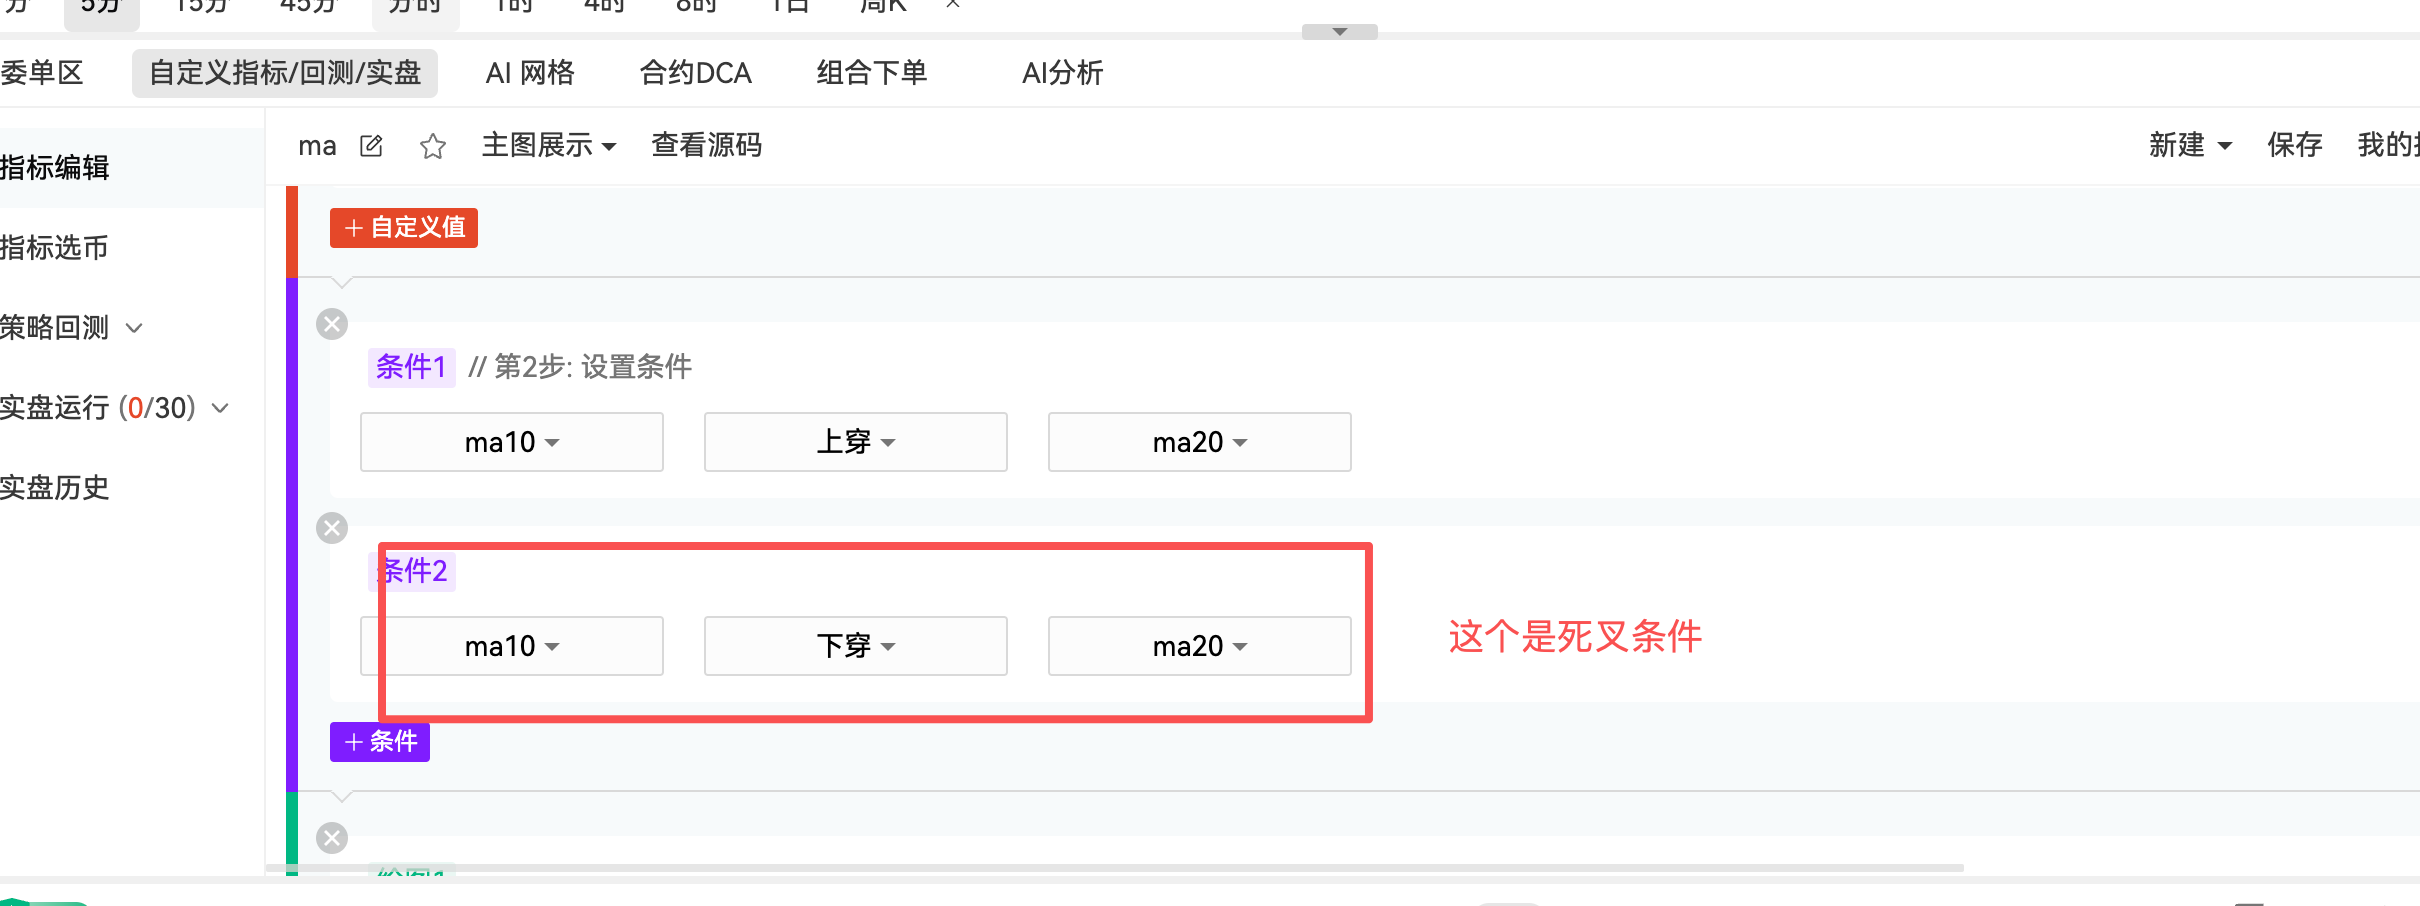
(2) Set Conditions: Define the trigger signals for the strategy. For example, MA10 crosses above MA20 (commonly known as "Golden Cross") as a buy signal.
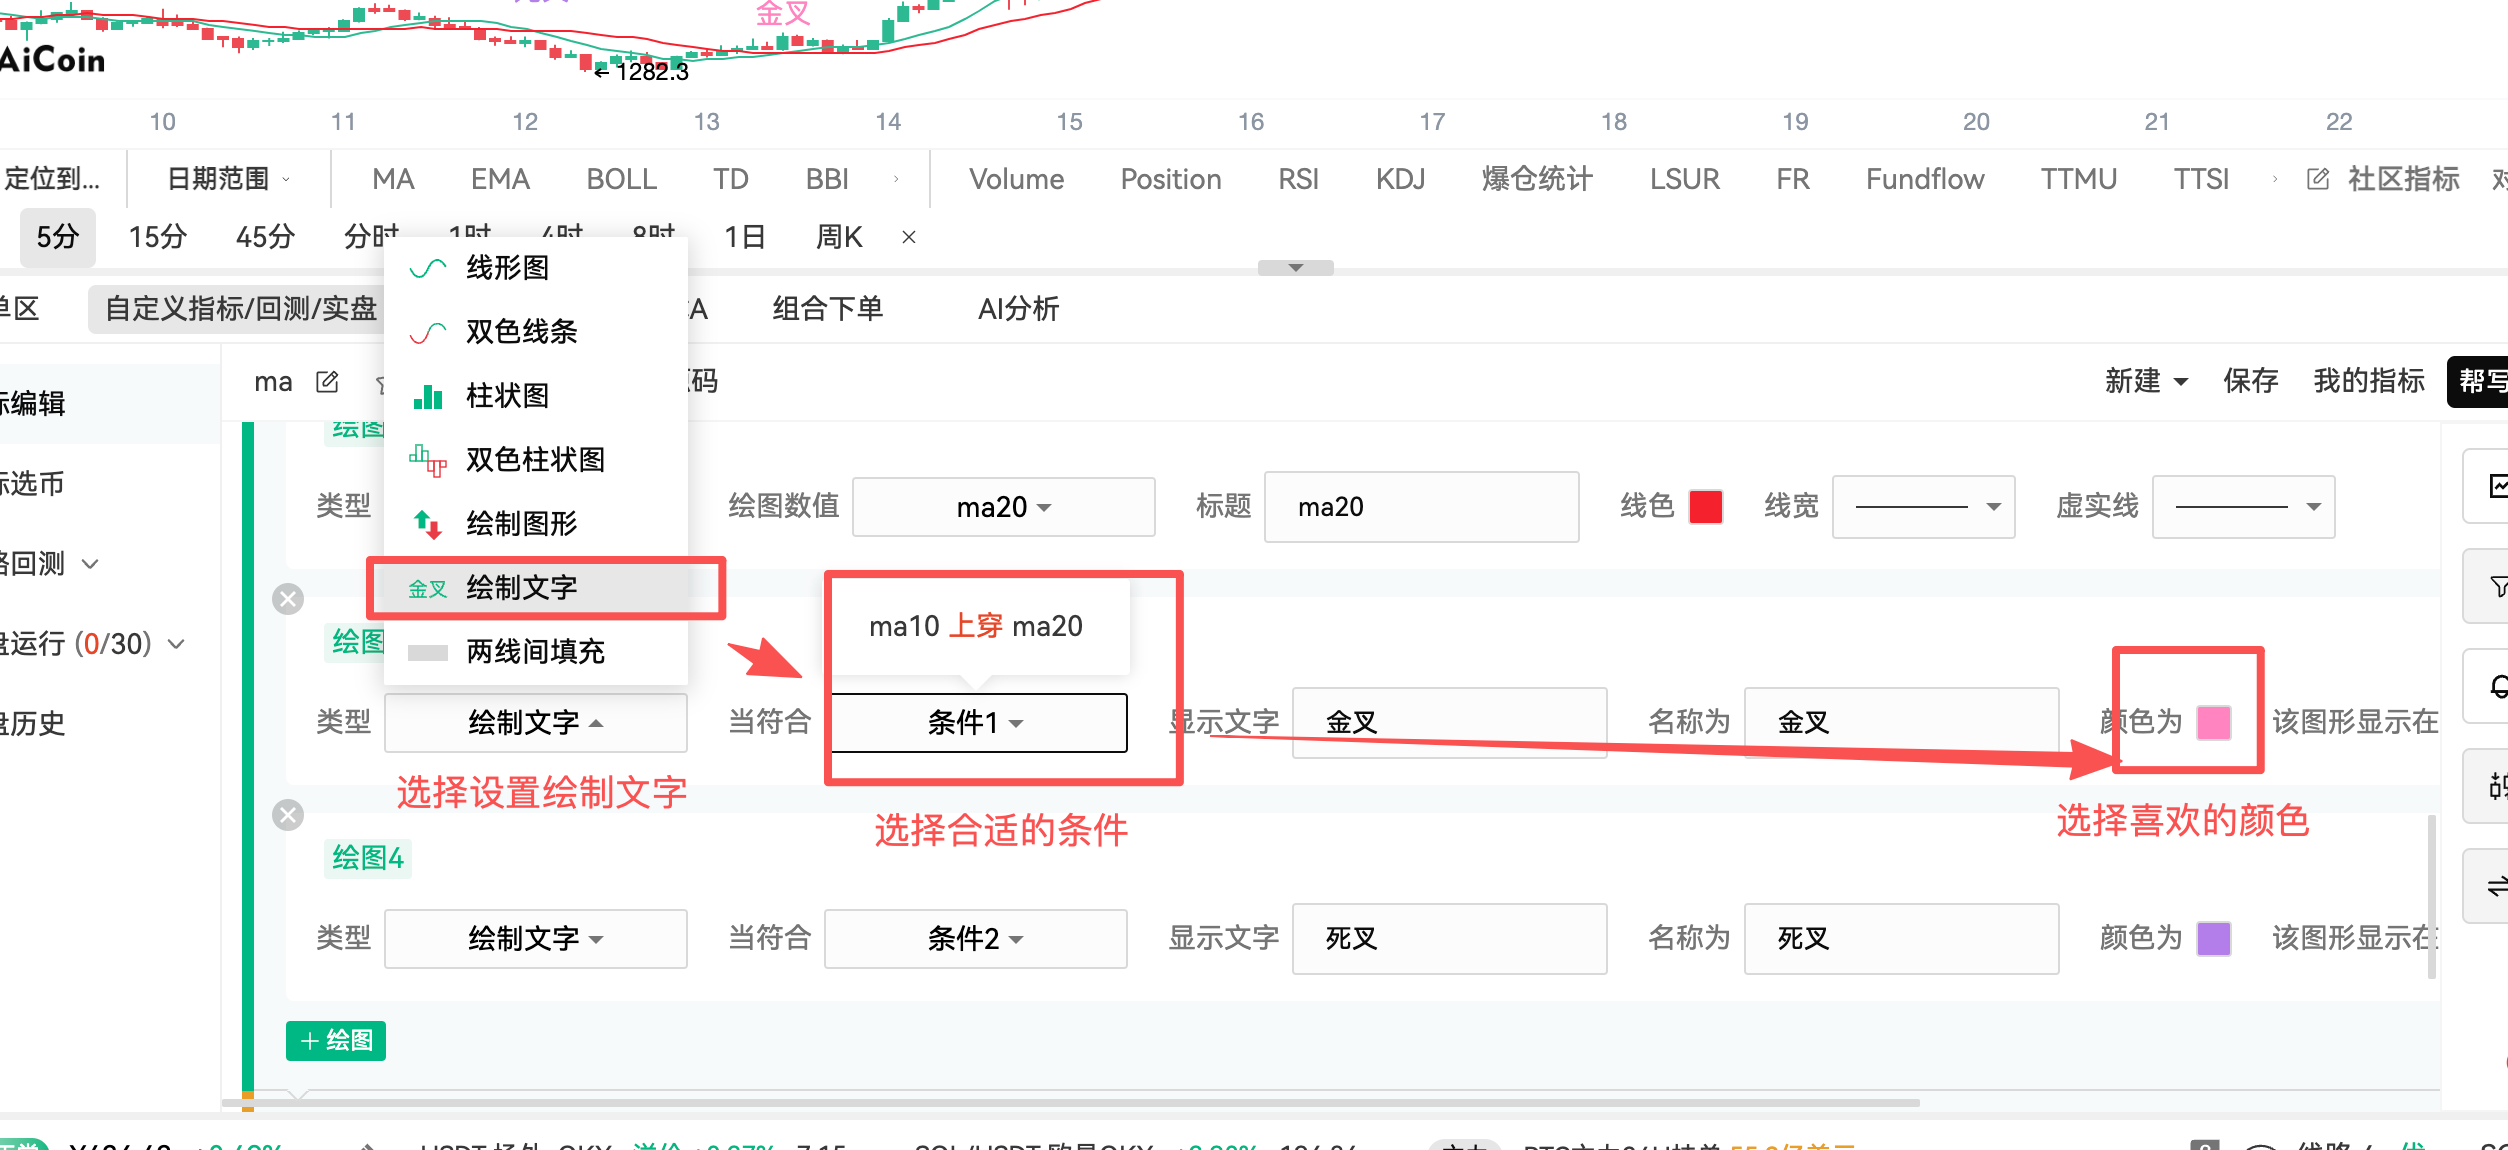
(3) Draw Display: Set attractive line colors for your moving averages, and add markers for buy and sell signals to easily distinguish them on the K-line chart.
Draw Moving Averages:

Draw Golden Cross and Dead Cross Markers:
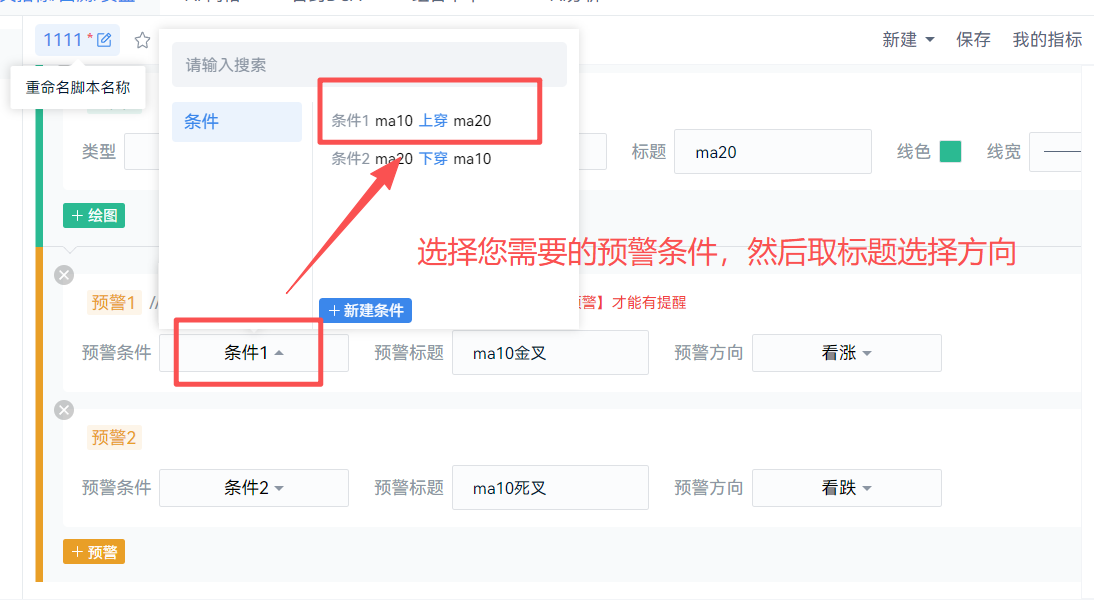
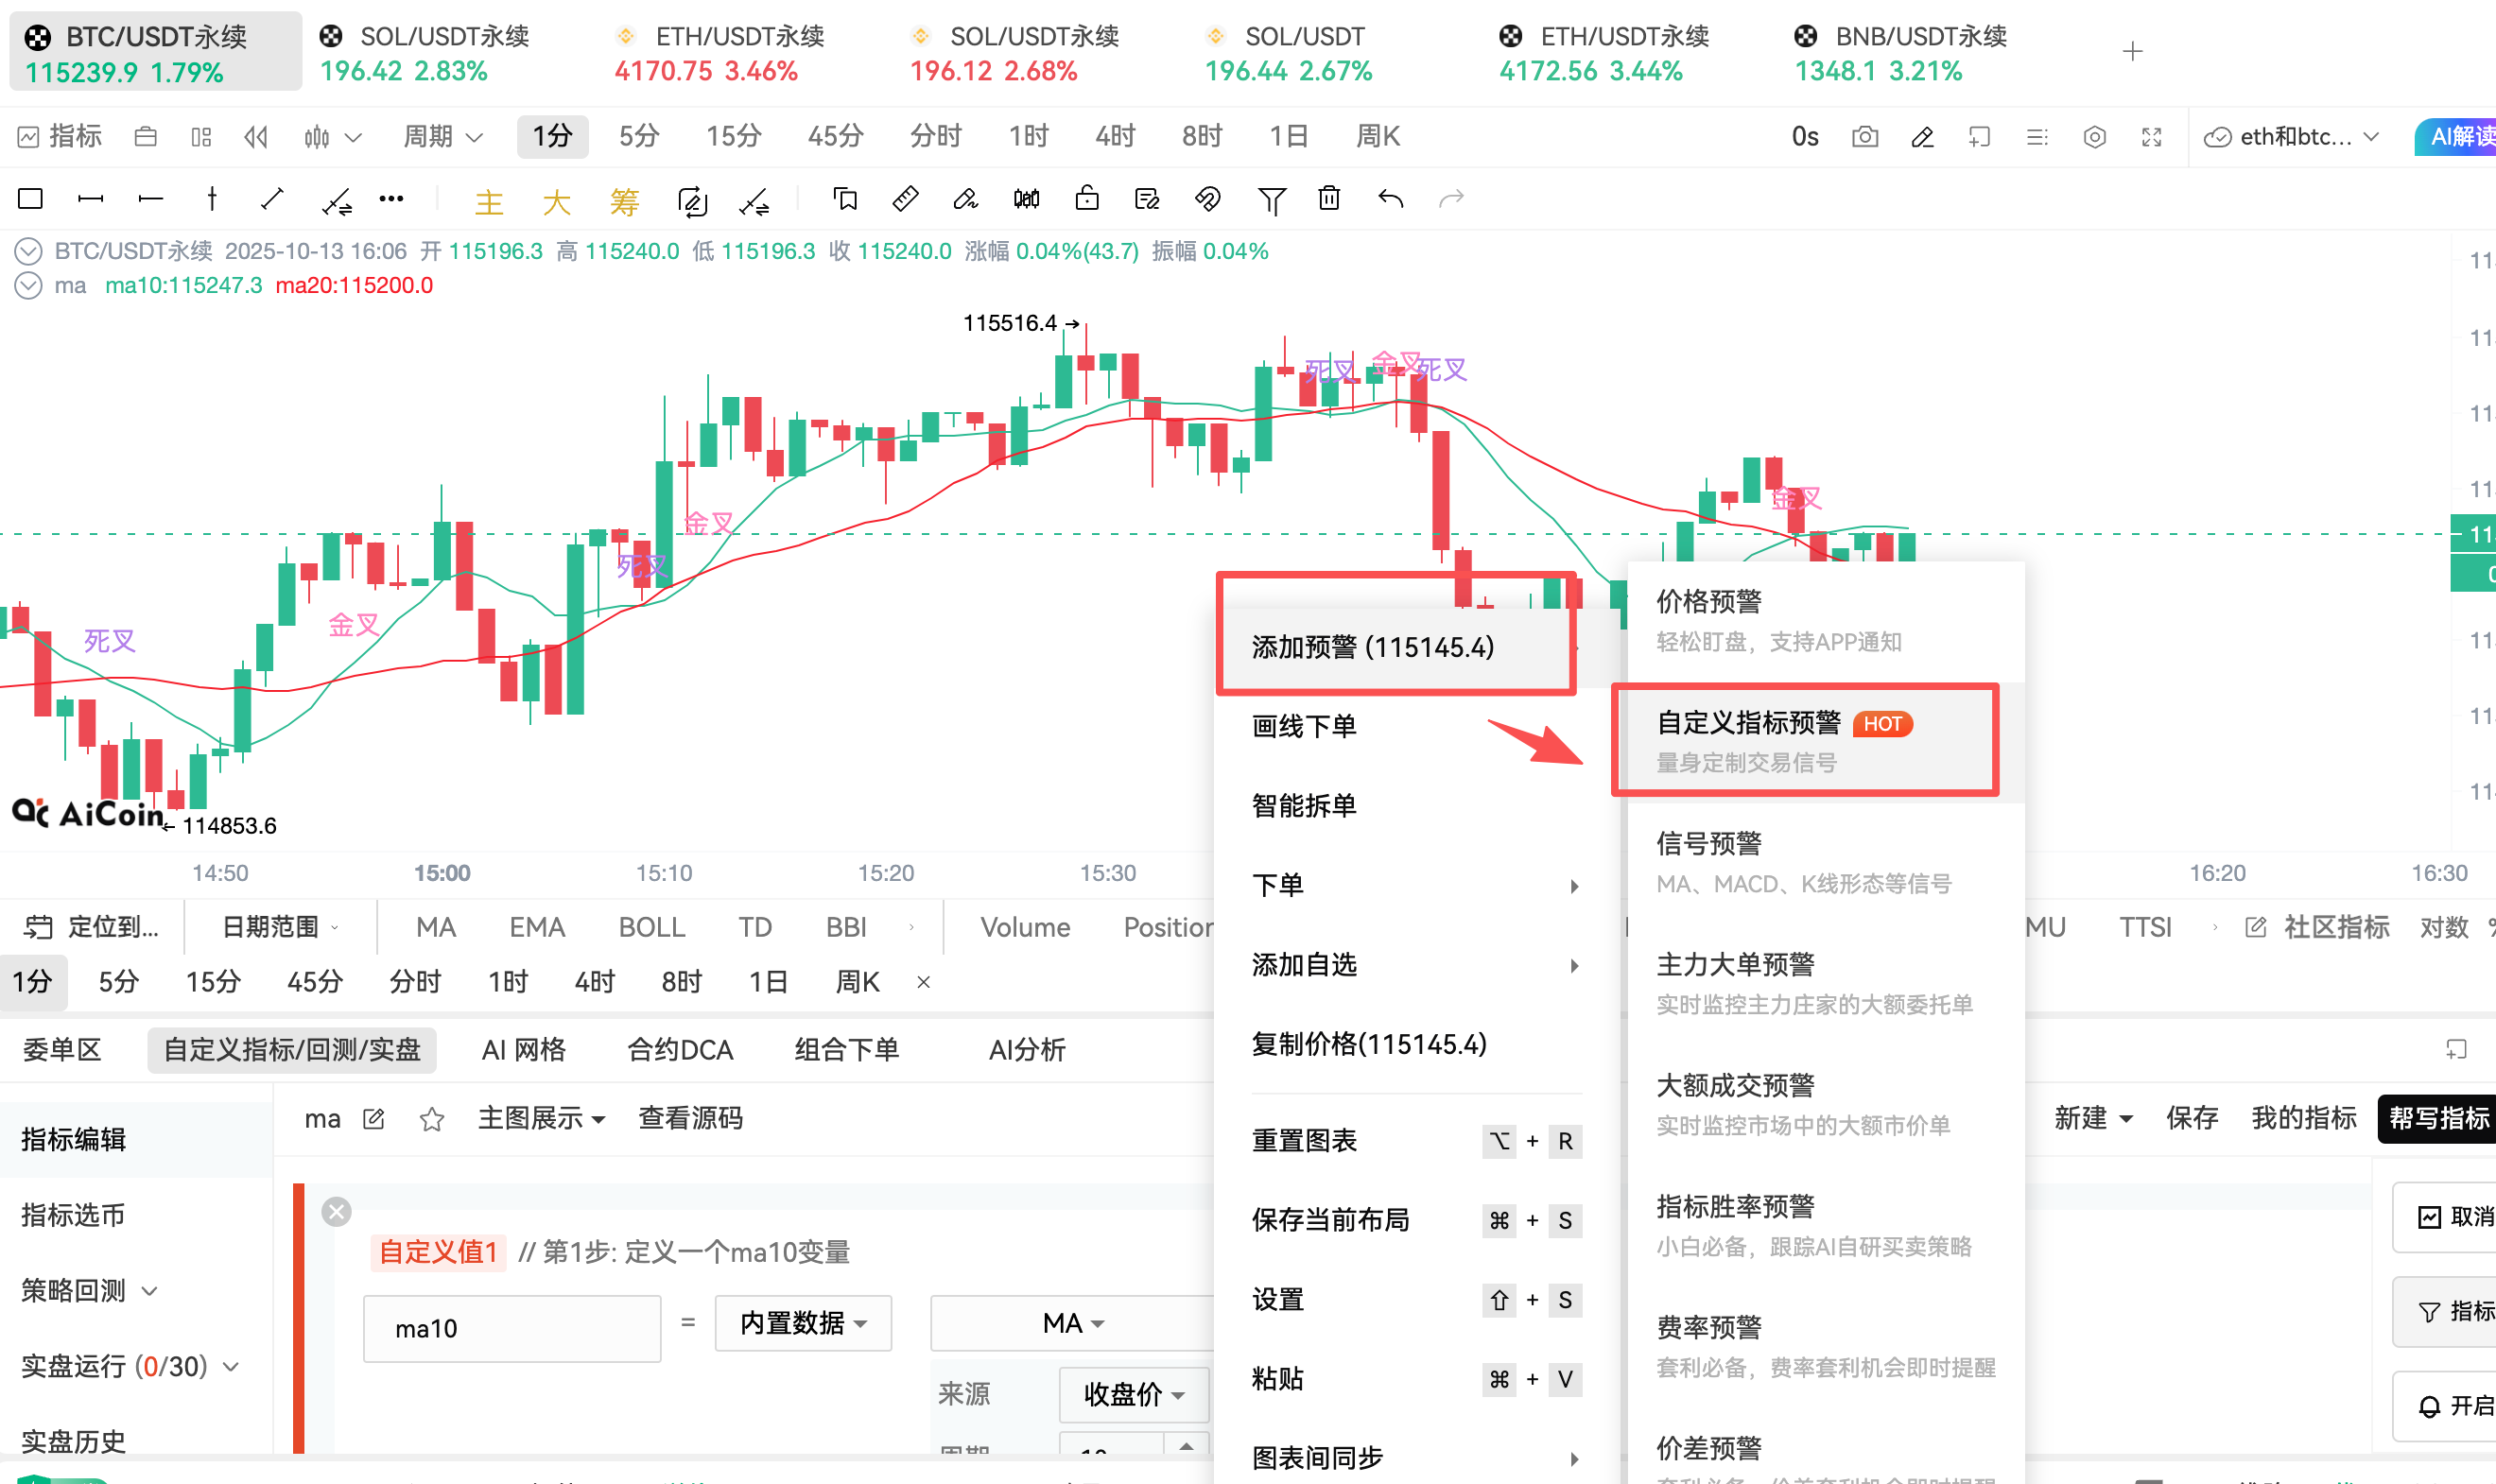
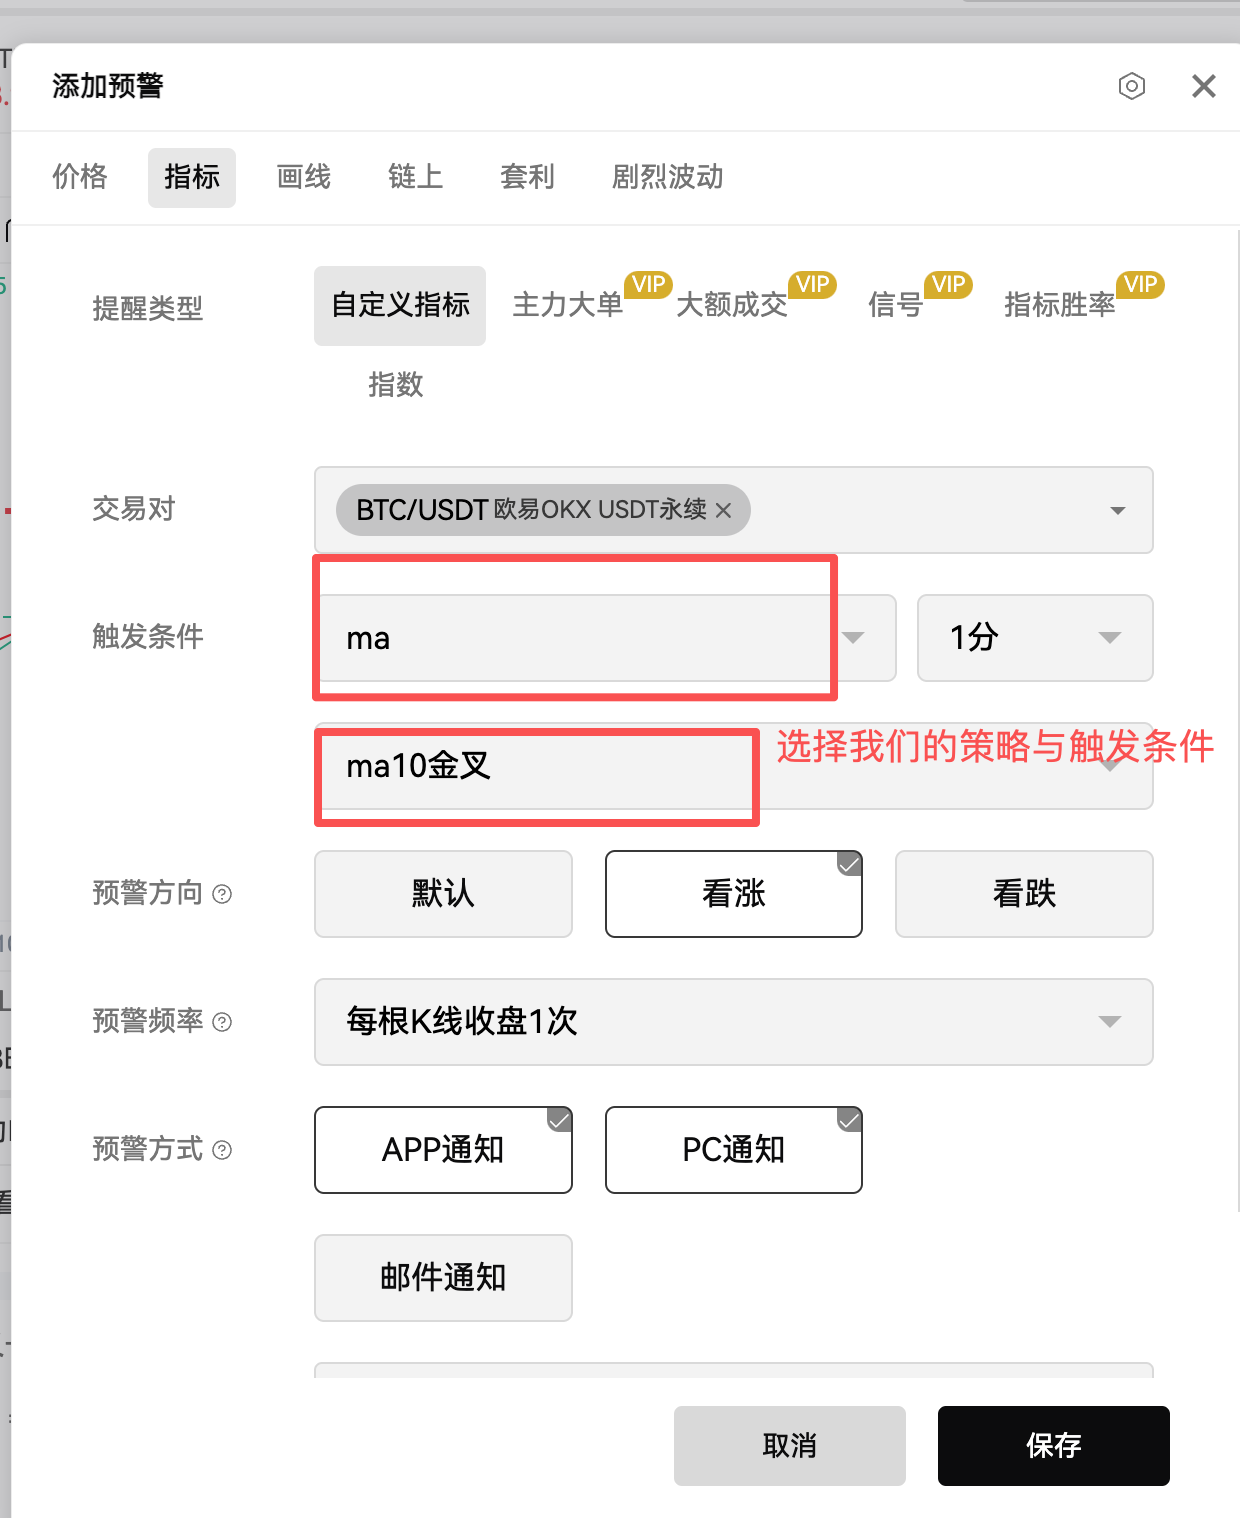
(4) Set Alerts: When the conditions set in step two (Golden Cross) are met, set the system to pop up or notify you to seize trading opportunities.
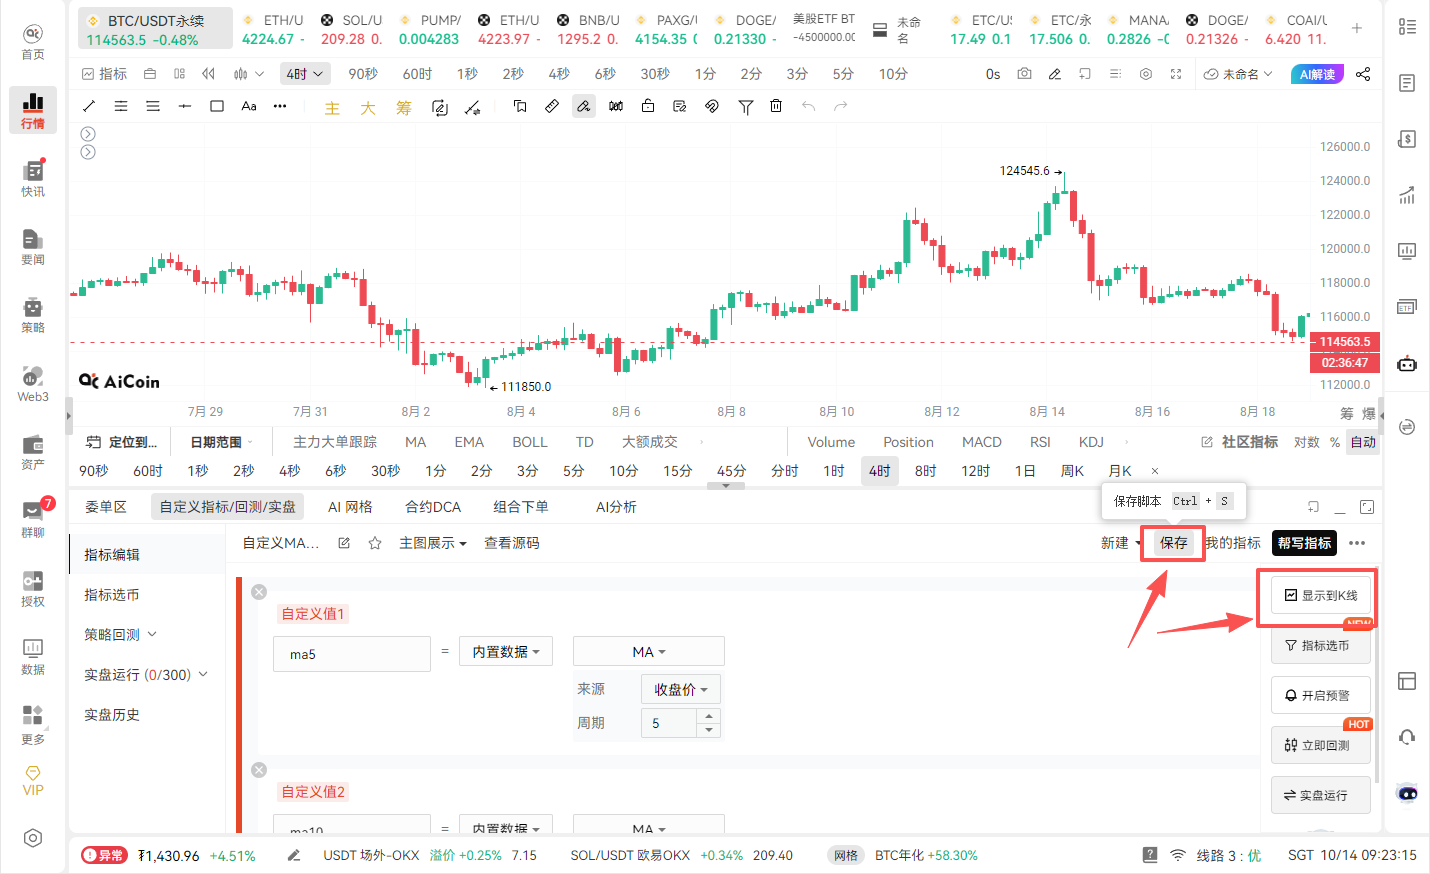
After completing the above four steps, click "Save" and select "Display on K-line," and a complete trading strategy is ready!
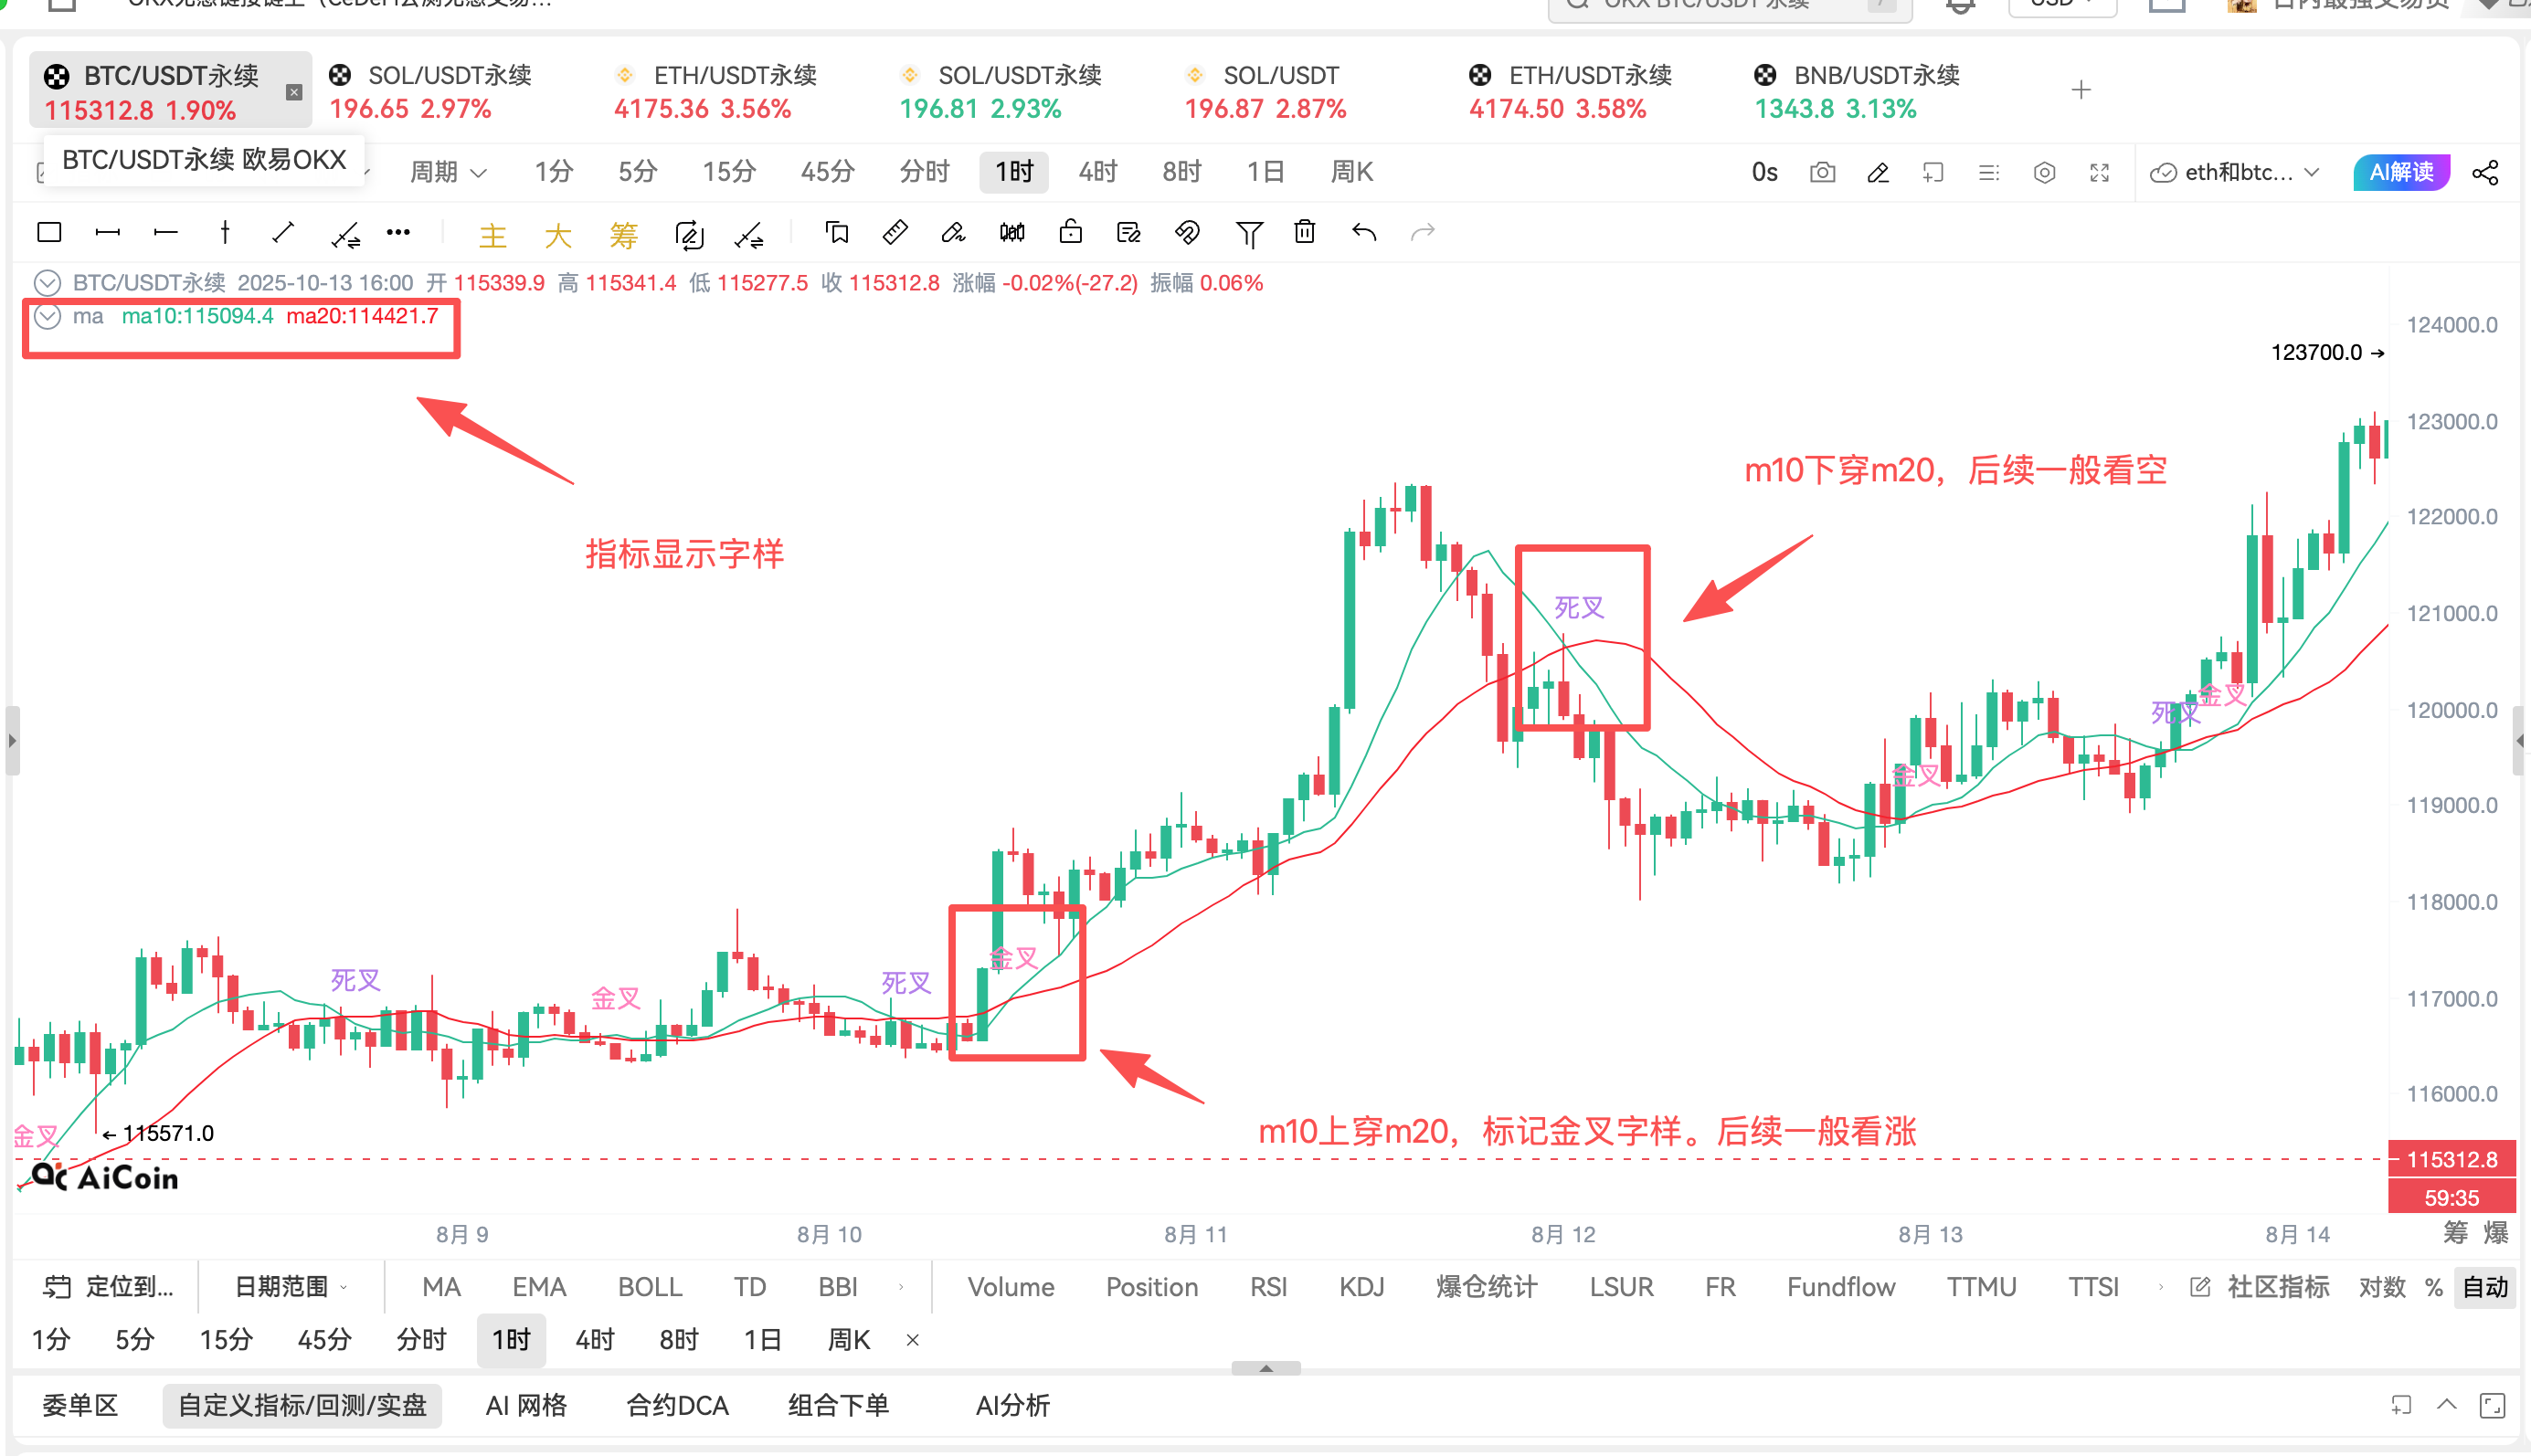
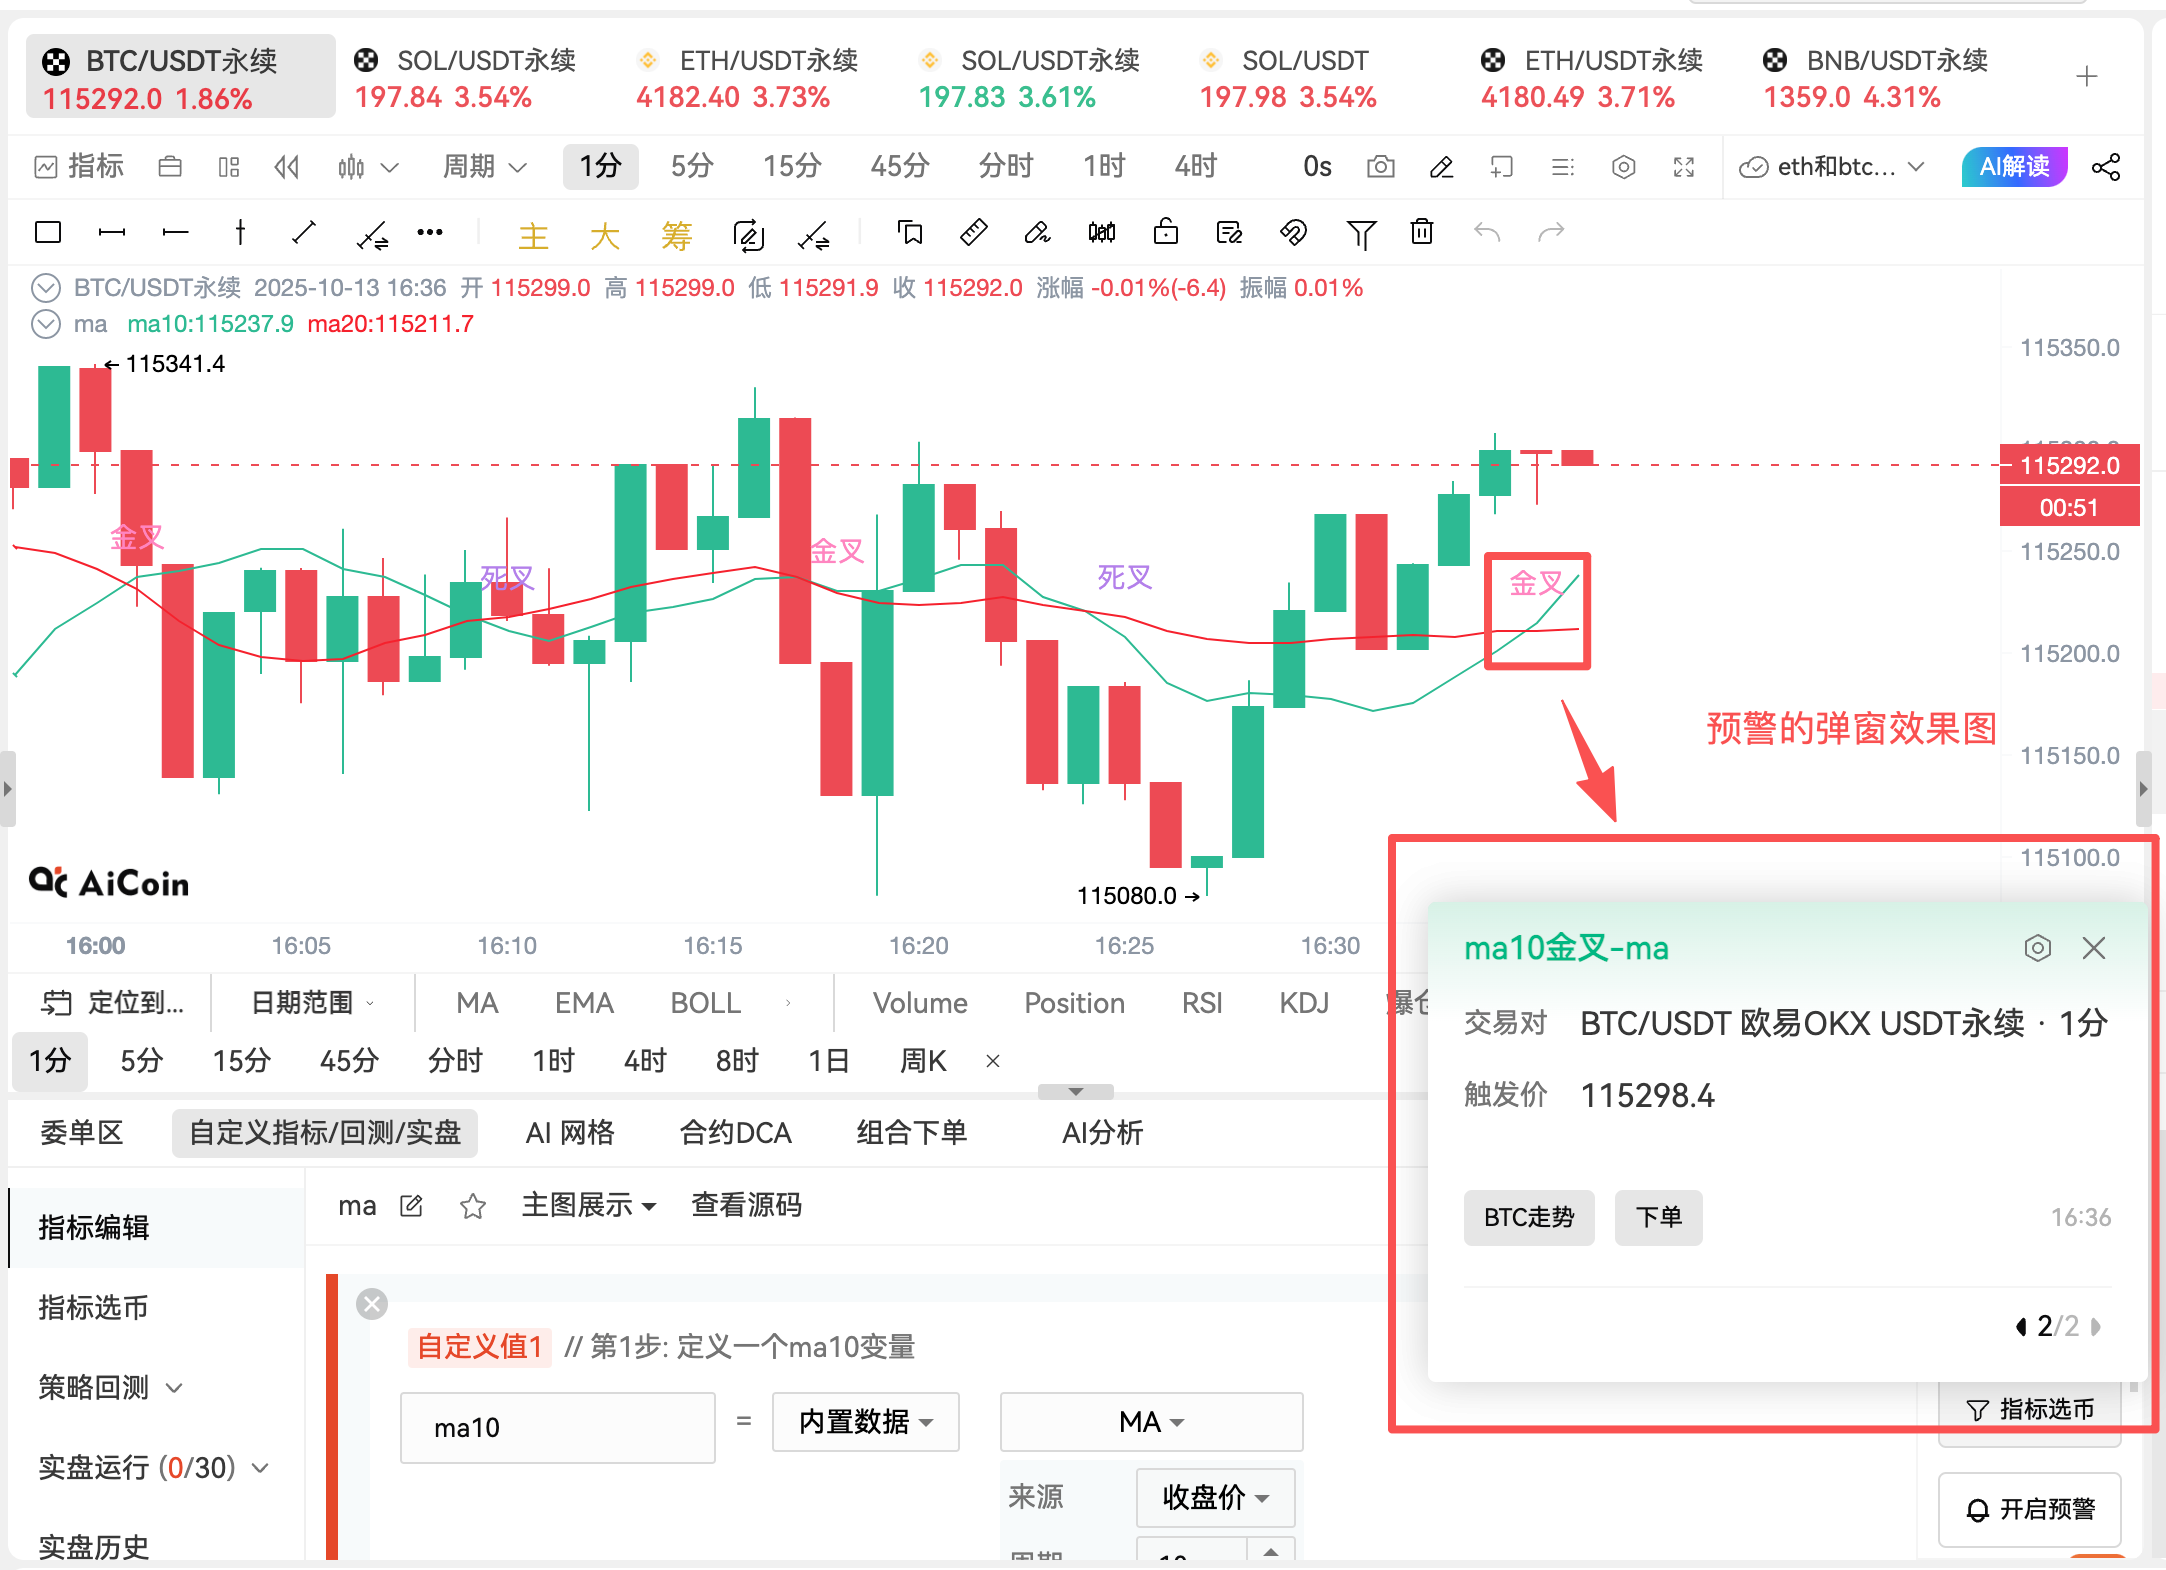
Let's take a look at the chart displayed on the K-line:
Then we will set up alerts to see the effect:
3. More Common Strategy References
Having learned the moving average strategy, you can use the same approach to create other common strategies, such as:
1. KDJ Indicator's "Cross Switch" Strategy
The crossing of the K and D lines in the KDJ indicator is also commonly used to determine buy and sell opportunities:
Golden Cross (K crosses above D): Like a car "shifting into gear," indicating a potential uptrend.
Dead Cross (K crosses below D): Like a car "shifting into reverse" or "slowing down," indicating a potential downtrend.
Key Point: The position of KDJ is very important; a low-position Golden Cross (oversold area) is more reliable, while a high-position Dead Cross (overbought area) is more dangerous.
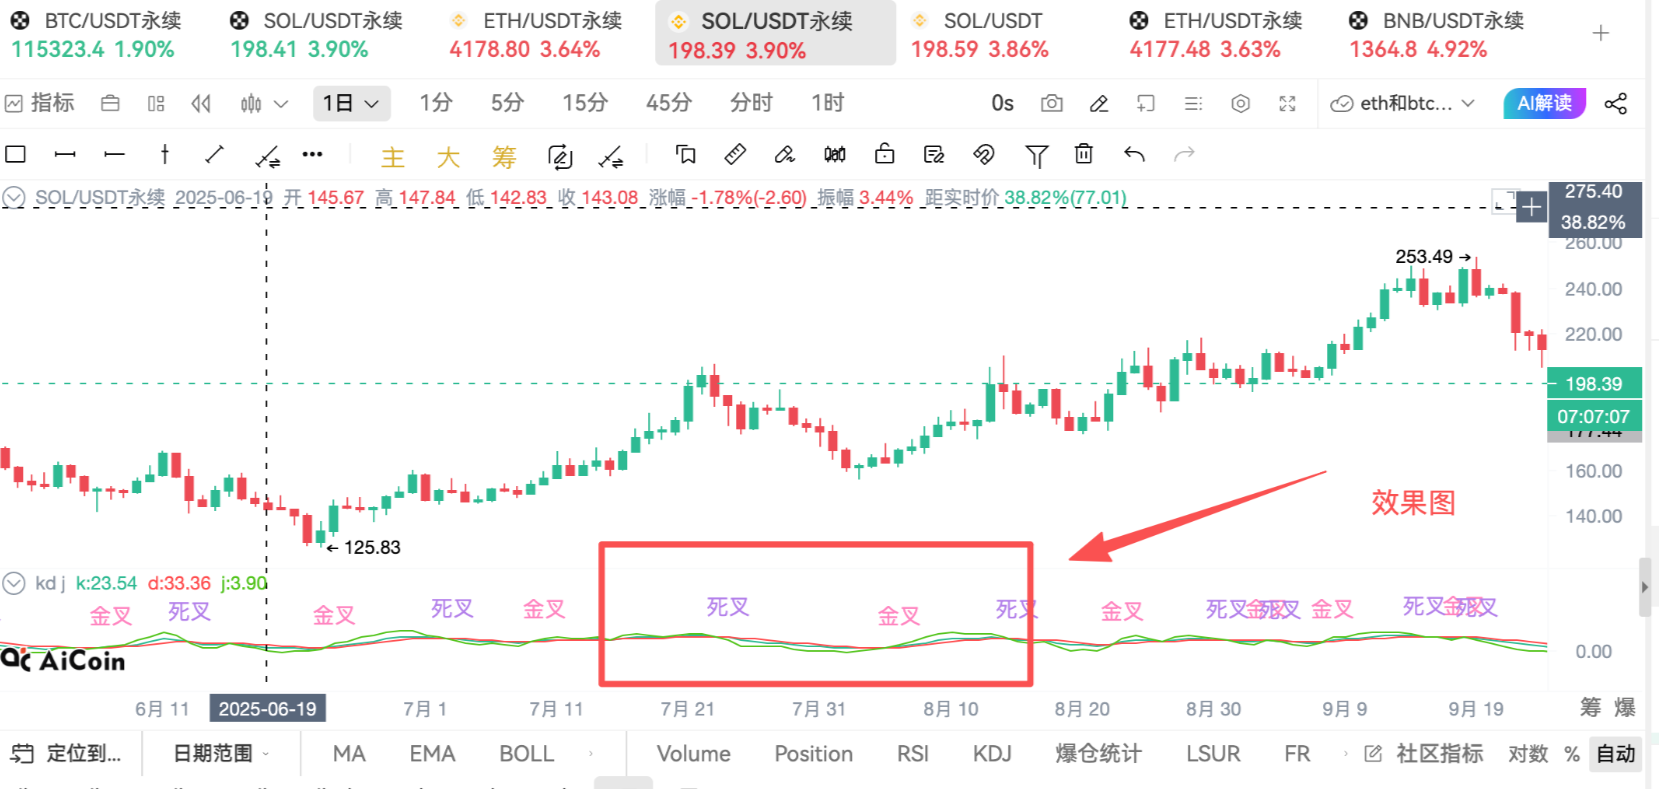
We have prepared a rich set of visual indicator templates, which have preset basic usages for you to add with one click.
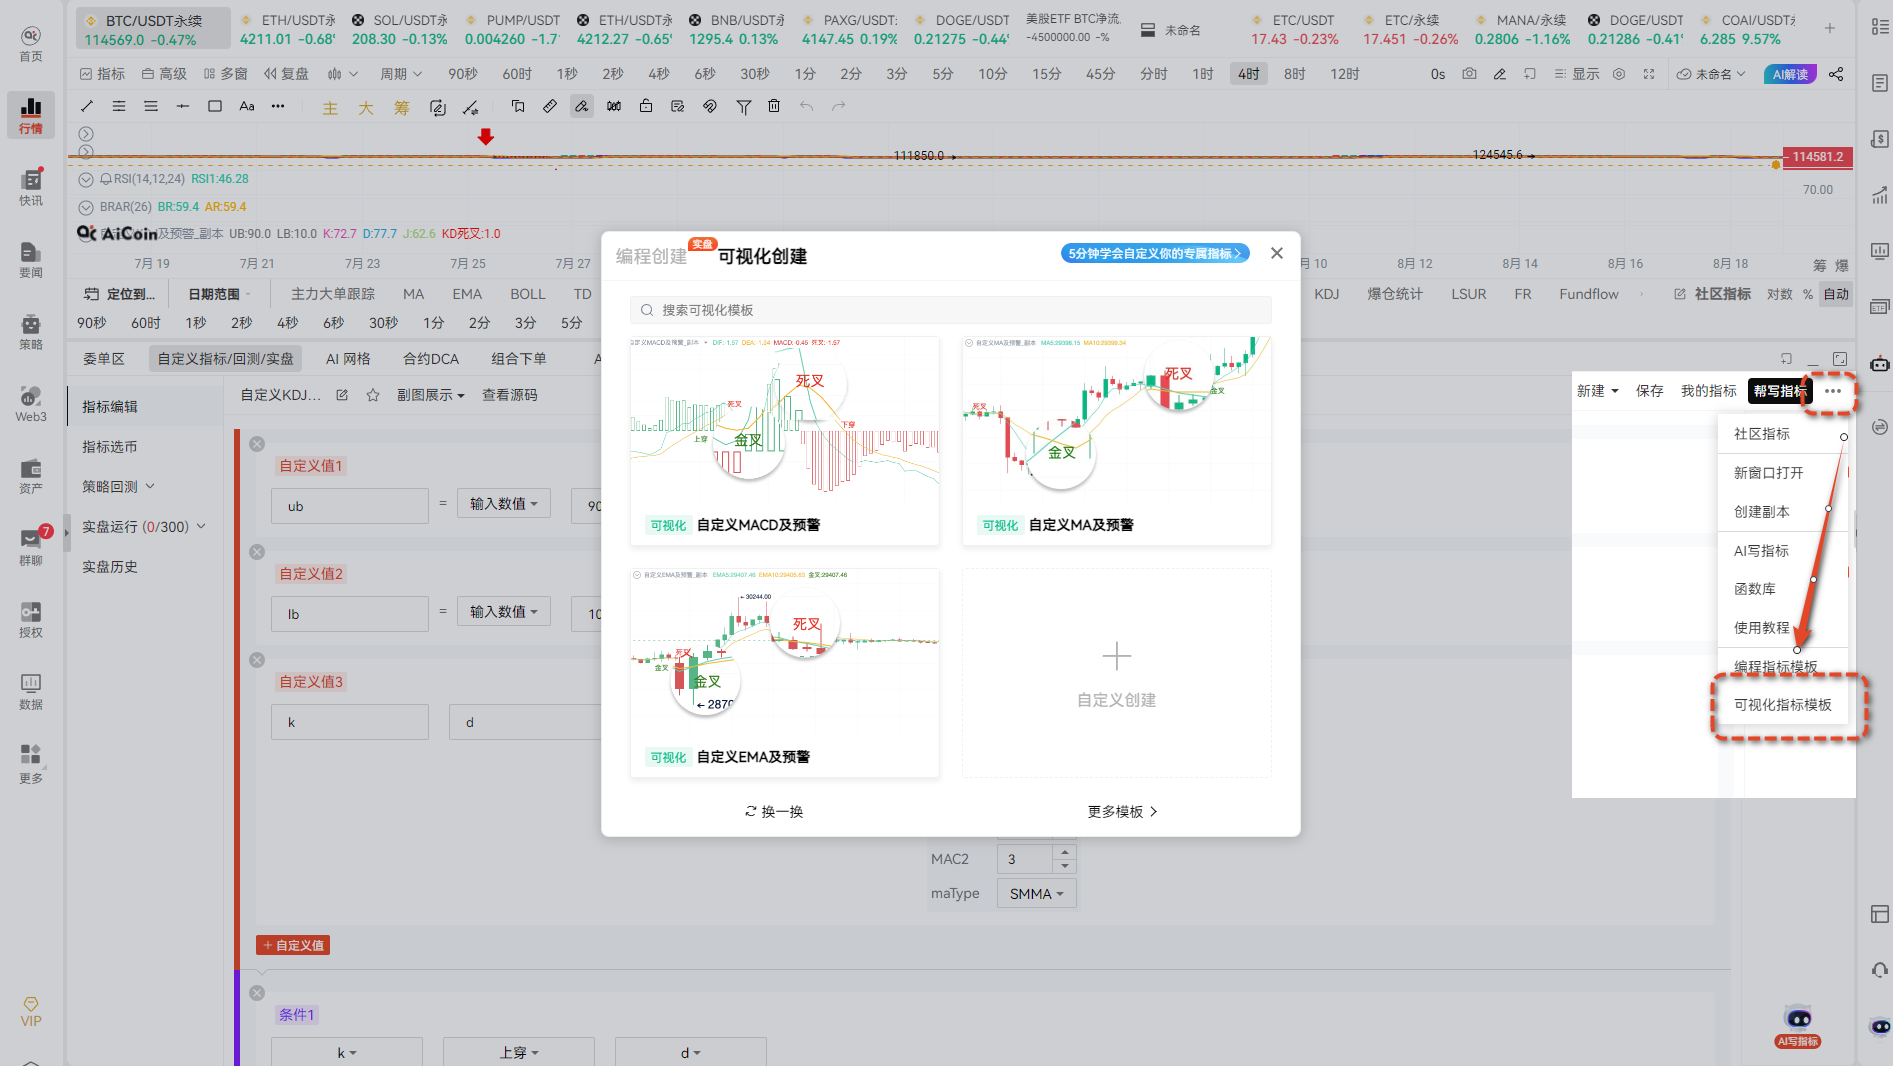
2. Advanced Strategy Play: View and Modify Code
Although it is a zero-code operation, the system generates professional code in the background. If you want to advance, you can always view the generated source code and modify and optimize it based on that to achieve more complex personalized strategies.
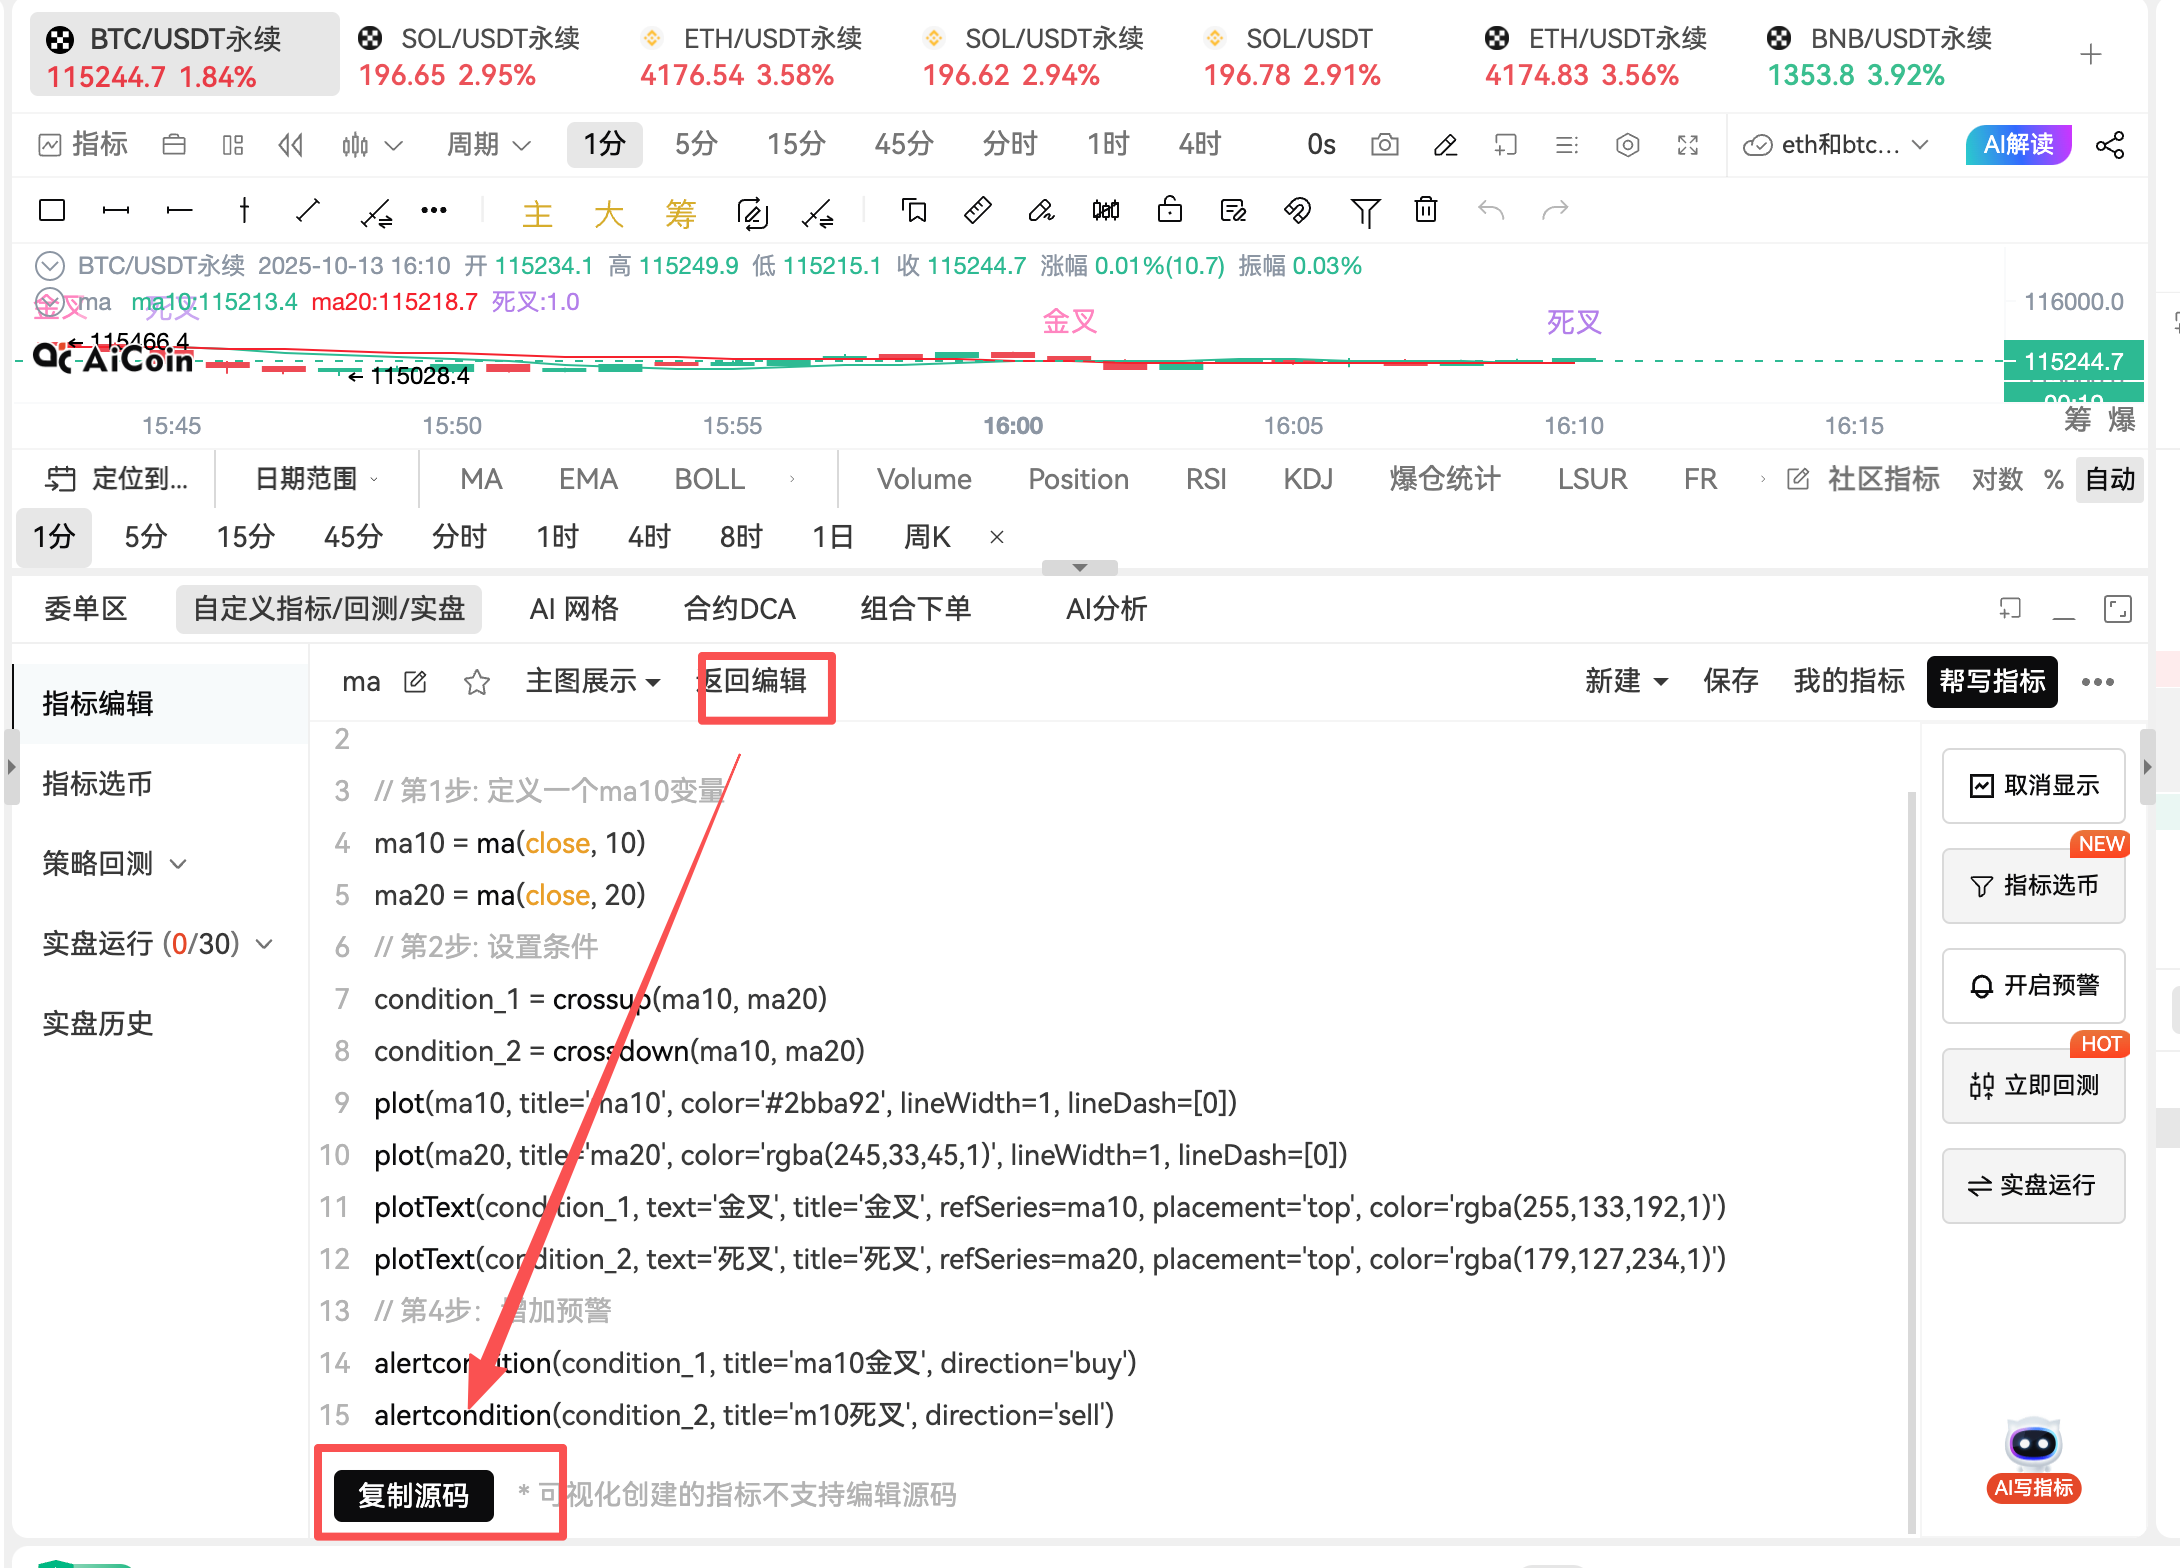
(Source Code Example, it's okay if you don't understand it; just know that this feature exists!)
// @version=2
// Step 1: Define a ma10 variable
ma10 = ma(close, 10)
ma20 = ma(close, 20)
// Step 2: Set Conditions
condition_1 = crossup(ma10, ma20)
condition_2 = crossdown(ma10, ma20)
// Step 3: Draw Graphics
plot(ma10, title='ma10', color='#2bba92', lineWidth=1, lineDash=[0])
plot(ma20, title='ma20', color='rgba(245,33,45,1)', lineWidth=1, lineDash=[0])
plotText(condition_1, text='Golden Cross', title='Golden Cross', refSeries=ma10, placement='top', color='rgba(255,133,192,1)')
plotText(condition_2, text='Dead Cross', title='Dead Cross', refSeries=ma20, placement='top', color='rgba(179,127,234,1)')
// Step 4: Add Alerts
alertcondition(condition_1, title='ma10 Golden Cross', direction='buy')
alertcondition(condition_2, title='ma10 Dead Cross', direction='sell')
Many tools on the market either require you to write pure code (too difficult for beginners) or only provide fixed templates (which cannot be personalized).
This "visual scripting" feature perfectly finds the "optimal middle ground":
For beginners: Zero-code operation, easily stepping into "strategy designer."
For professionals: Supports self-developed language, meeting the flexible needs of complex strategies.
This allows you to no longer rely entirely on subjective experience or blindly follow trends, but to turn your trading ideas into concrete, executable strategies.
4. Advanced Learning Resources
If you want to upgrade from "strategy designer" to "strategy developer," you can check out the learning materials provided by the platform:
Custom Indicator Tutorial: https://www.aicoin.com/article/355031.html
Custom Indicator Alert Tutorial: https://www.aicoin.com/article/355033.html
Custom Indicator Function Documentation: https://www.aicoin.com/article/355796.html
Automated Live Trading Quick Start: https://www.aicoin.com/article/373213.html
Conclusion
The "visual scripting" feature is not just a tool of the platform; it is a bridge that helps ordinary traders make the leap from "novice to professional." The zero-code operation lowers the entry barrier, while the self-developed language ensures professional depth. This kind of "dual consideration" design may become the future direction of trading tool development.
We recommend users interested in trying strategy trading to experience it, as it may open up new perspectives on trading.
Note: If you need to customize complex and desired strategies, you can contact us for custom indicators; we offer custom indicator services.
Join our community to discuss and become stronger together!
Official Telegram community: t.me/aicoincn
AiCoin Chinese Twitter: https://x.com/AiCoinzh
Group Chat - Wealth Group: AiCoin - Leading Data Market, Intelligent Tool Platform
Reminder: Trading involves risks; this tutorial is for learning purposes only and does not constitute any investment advice.
Disclaimer: This article represents only the personal views of the author and does not represent the position and views of this platform. This article is for information sharing only and does not constitute any investment advice to anyone. Any disputes between users and authors are unrelated to this platform. If the articles or images on the webpage involve infringement, please provide relevant proof of rights and identity documents and send an email to support@aicoin.com. The relevant staff of this platform will conduct an investigation.