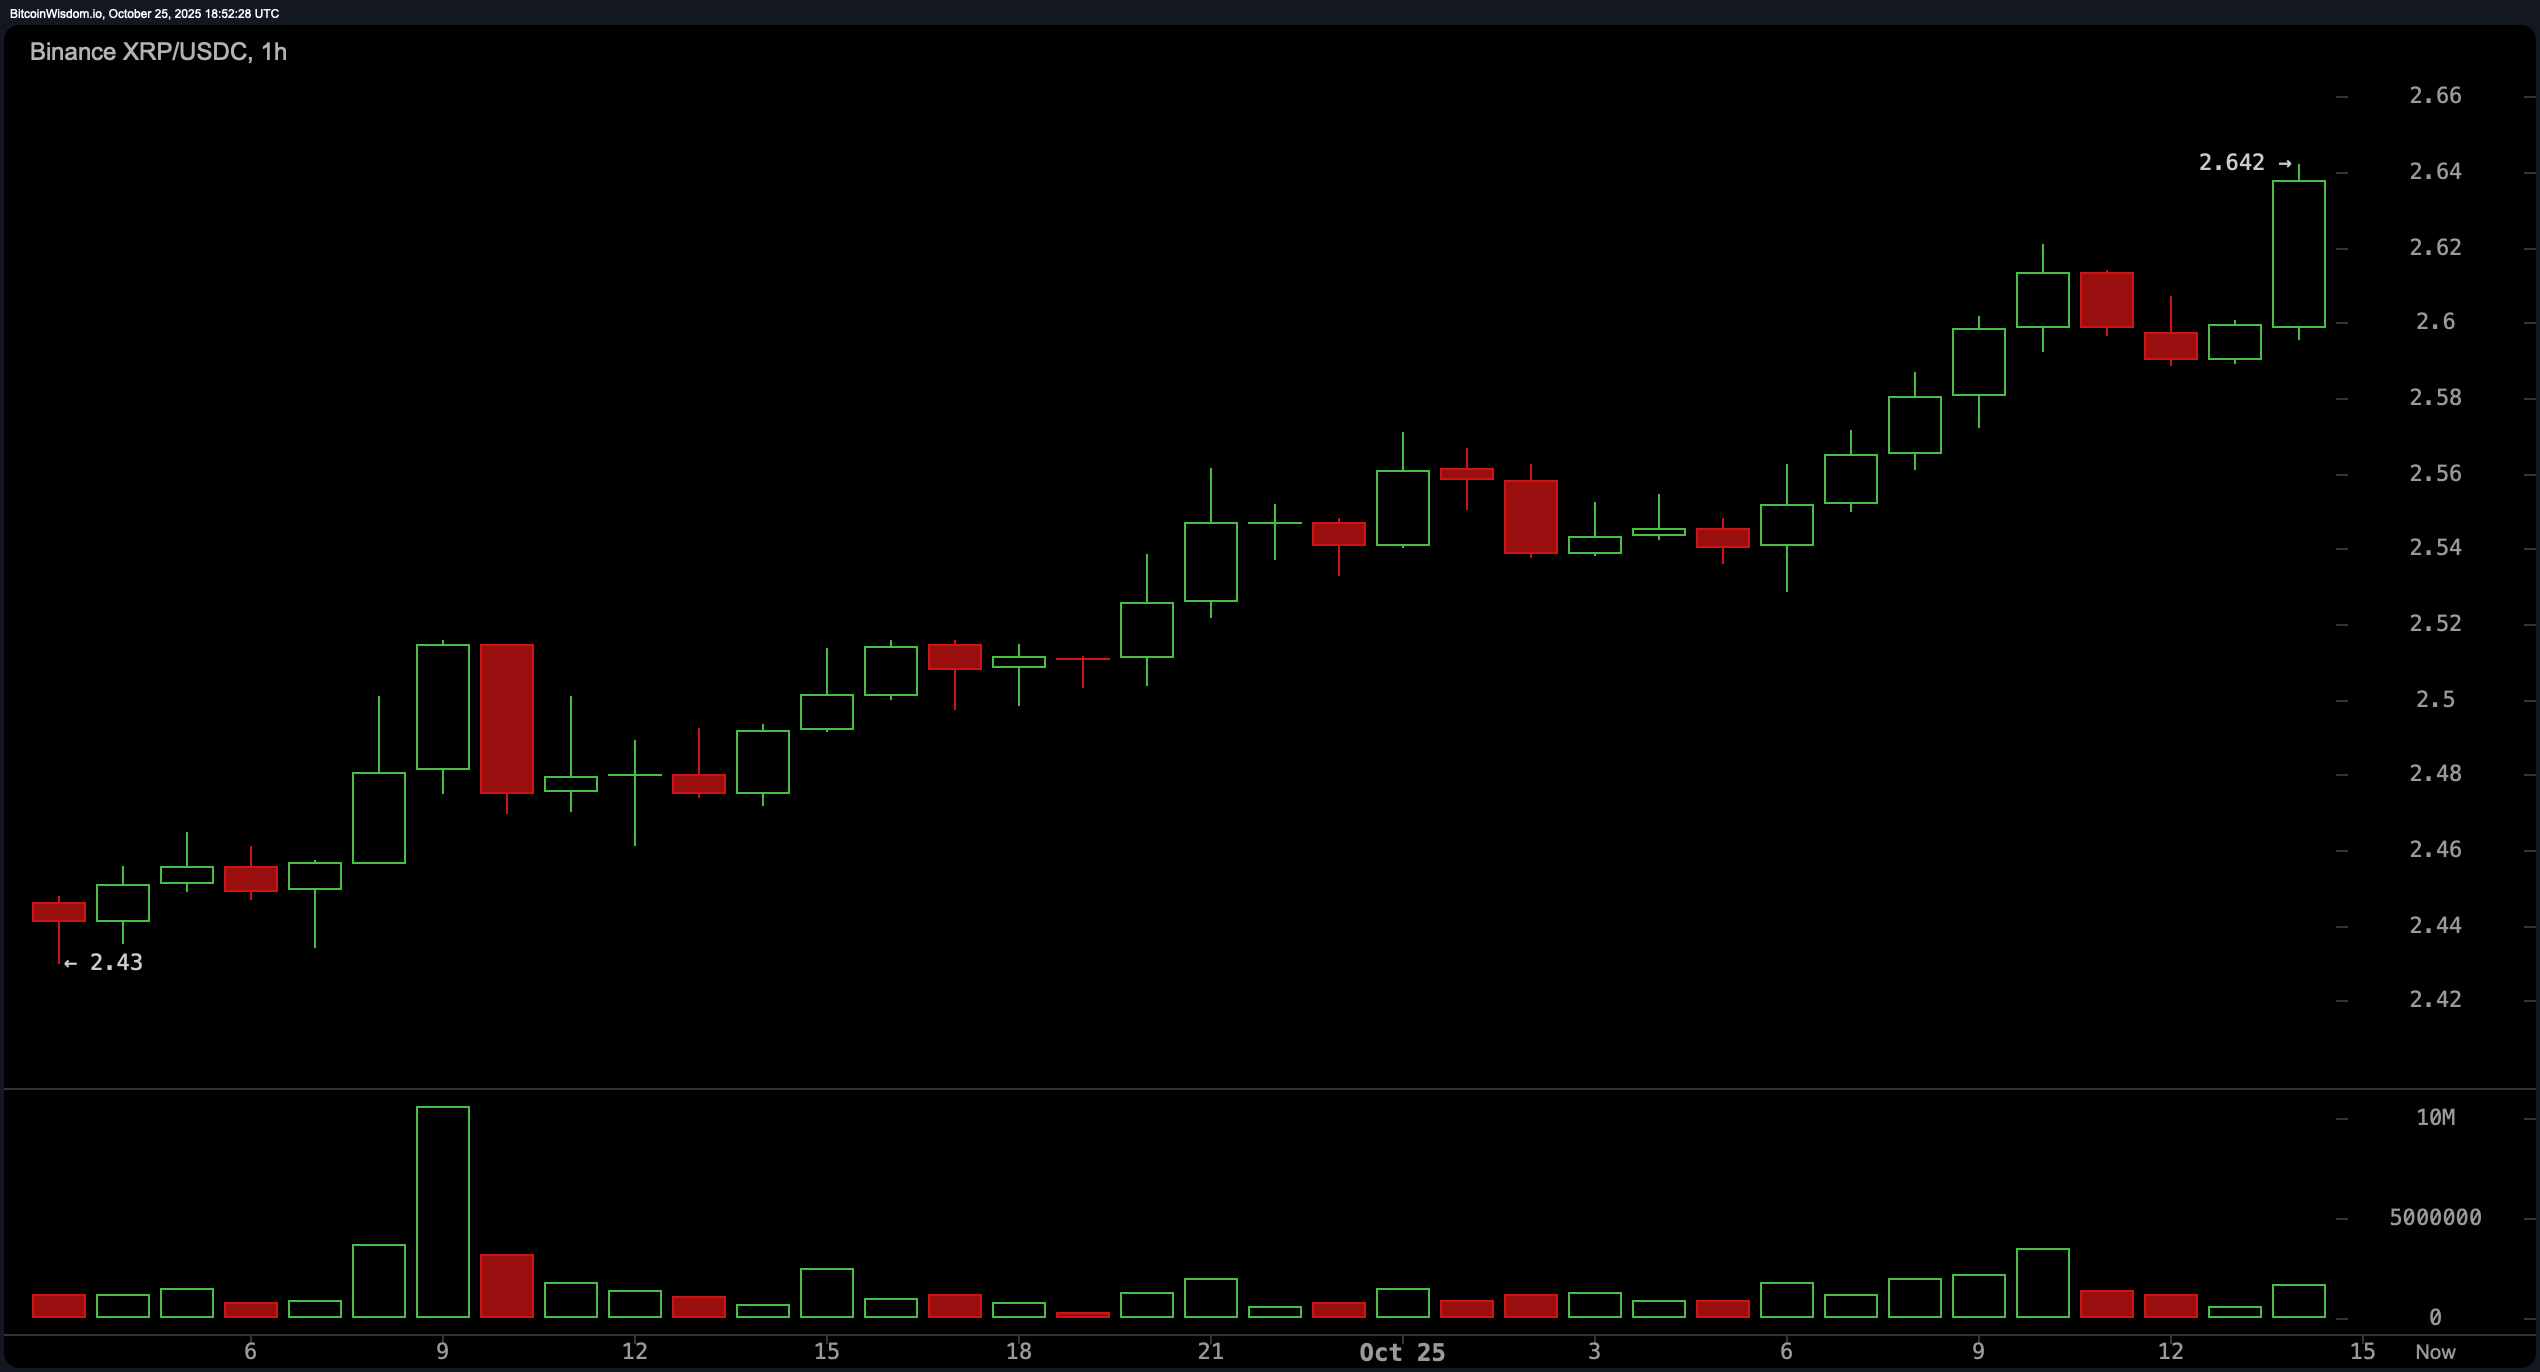
On the 1-hour chart, XRP strutted from $2.43 to $2.642 in a neatly defined uptrend outpacing the U.S. dollar by 6%. The price action has been characterized by a cadence of higher highs and higher lows, the kind of rhythmic dance short-term traders dream of.
Momentum is beginning to plateau near the $2.62 $2.63 mark, a familiar ceiling in recent sessions. Eyes are glued to $2.70 — if XRP breaks through, the next stop is $2.80 and beyond. But if it gets shy again, the $2.54–$2.56 zone may offer support for a potential rebound, especially if volume picks up the tempo.

XRP/USDC via Binance 1-hour chart on Oct. 25, 2025.
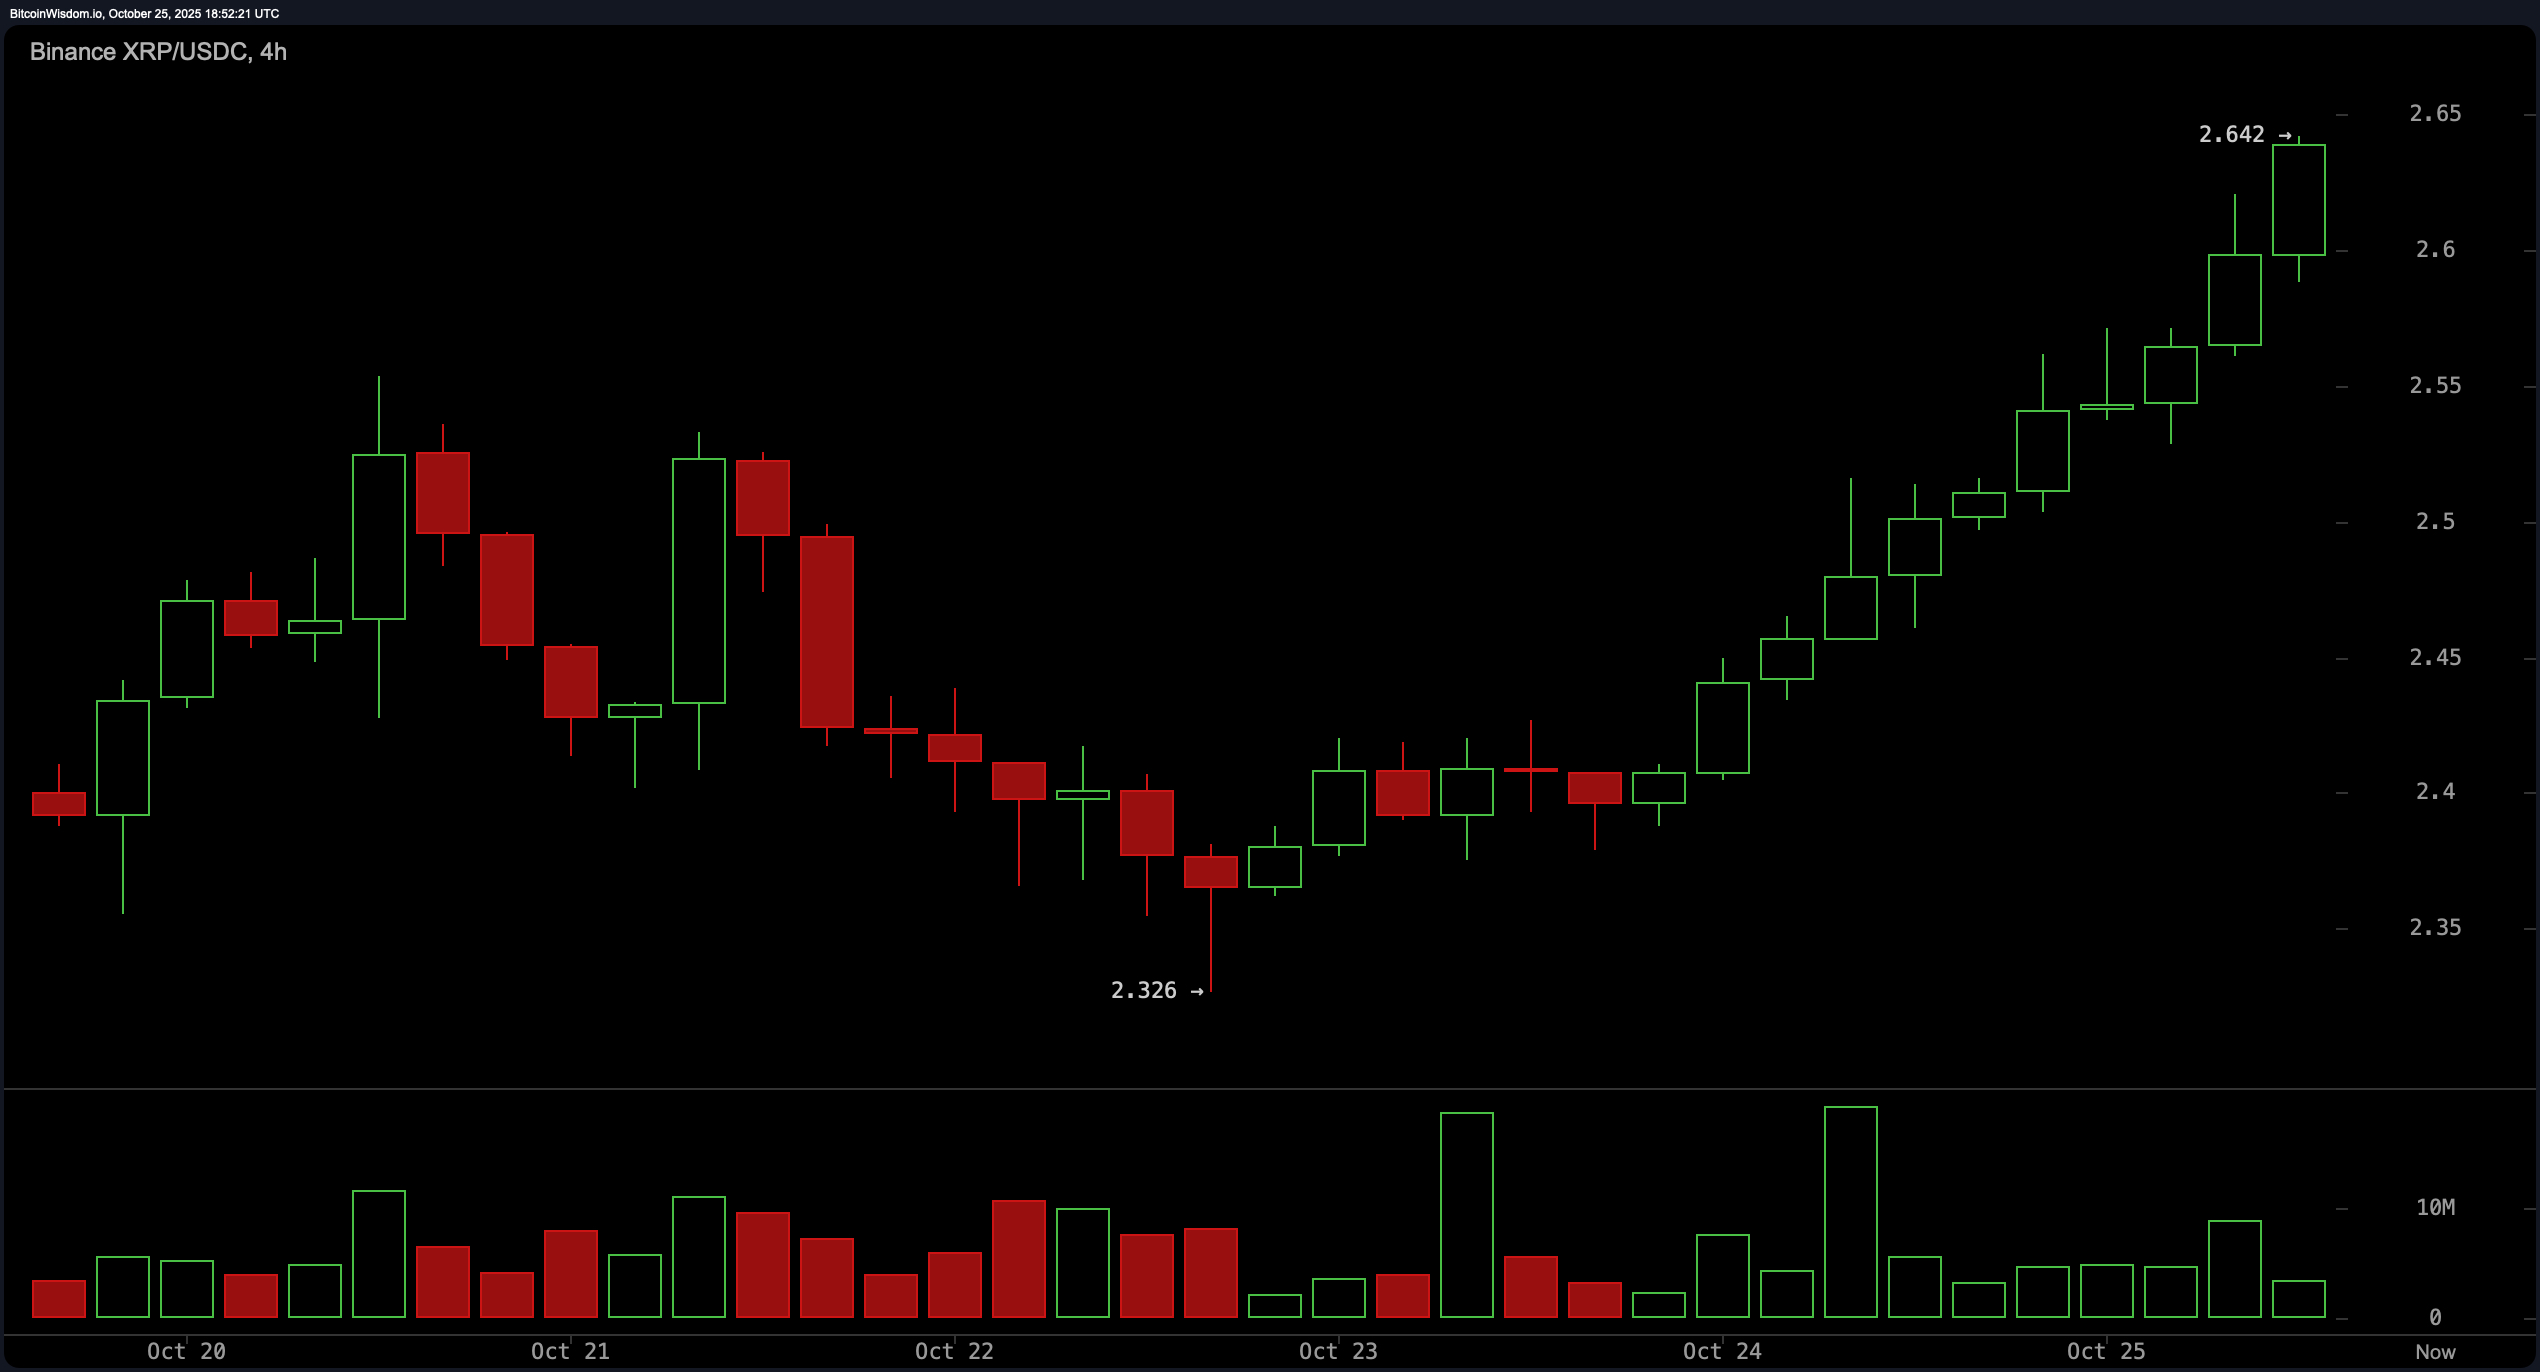
Zooming out to the 4-hour chart, the narrative expands with a bounce from the $2.32 low (recorded on Oct. 22) to the current $2.62 to $2.64 range. The trend is housed within a rising channel, giving the bulls some credibility — but only just. While higher lows suggest optimism, recent green candles are burning with less volume, indicating that enthusiasm might be slipping. The key support to watch here is $2.42–$2.45; if XRP starts to trip, that’s the cushion where it might land. But let’s not get ahead of ourselves — $2.66 is the immediate resistance, with $2.70 waiting in the wings if things get spicy.

XRP/USDC via Binance 4-hour chart on Oct. 25, 2025.
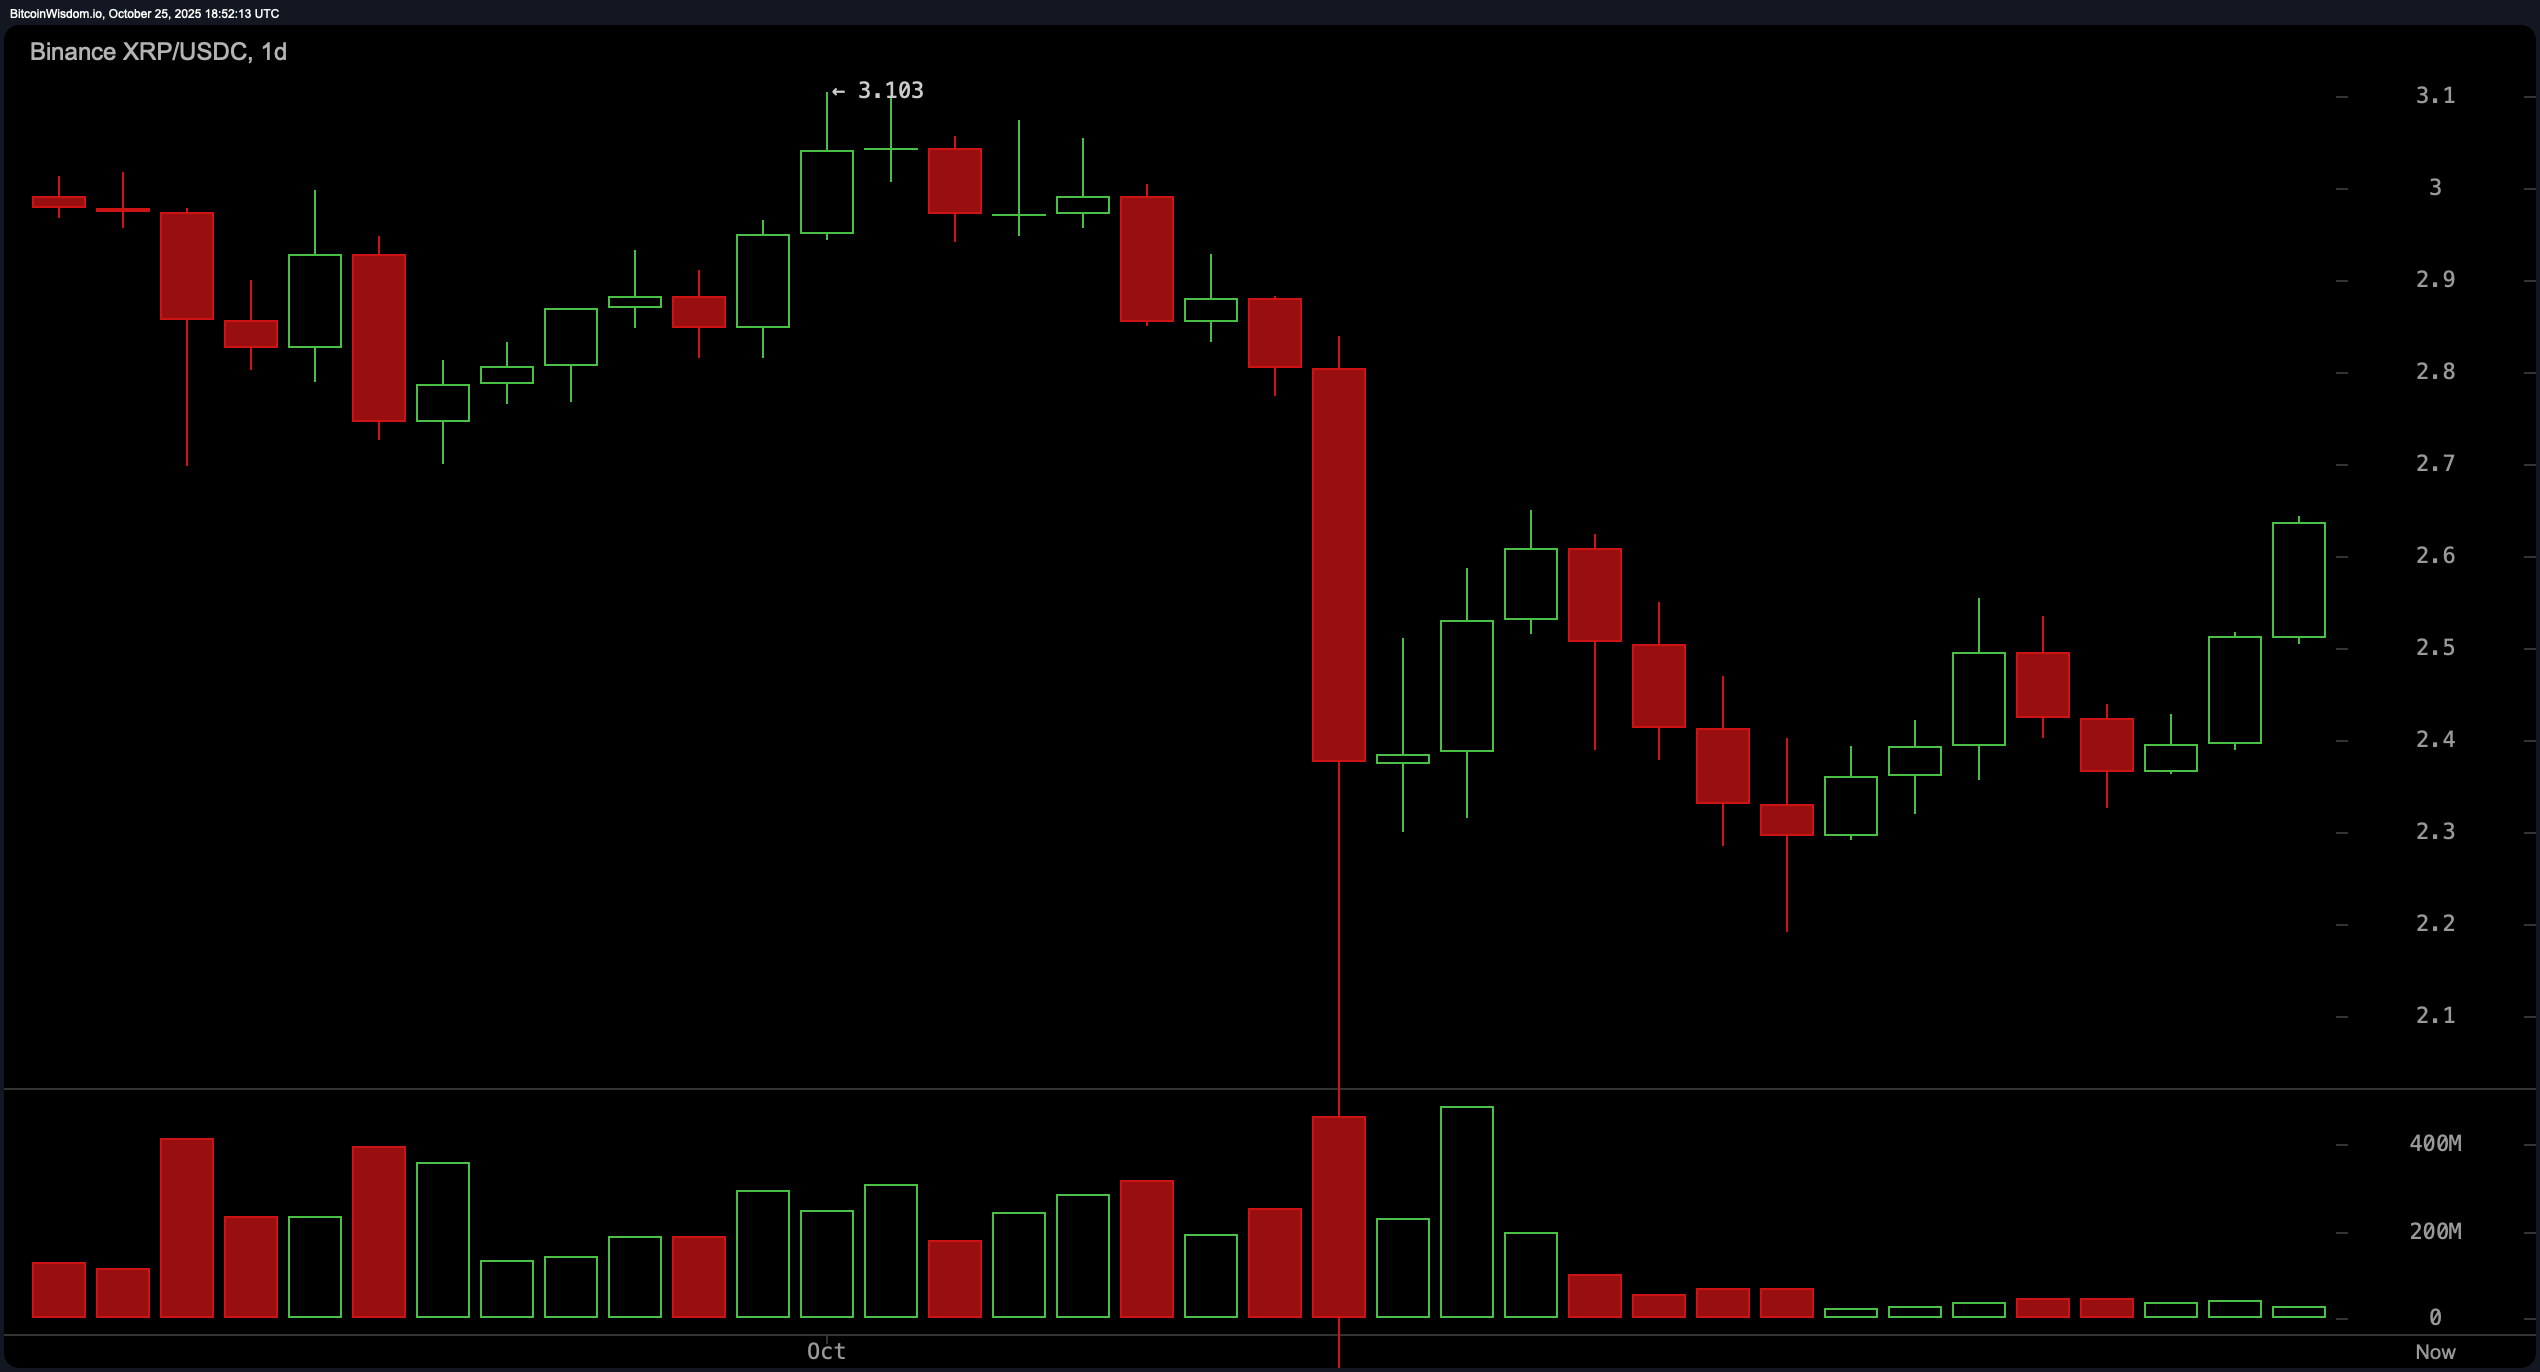
From a daily perspective, XRP has been on a bit of a rollercoaster. After being unceremoniously dumped from $3.10 down to $2.10, the token pulled a “V-shaped” recovery worthy of a comeback montage. Still, daily candles show indecisiveness, with price action hesitating just below the heavyweight resistance zone between $2.80 and $3.00. The volume profile is nowhere near the chaotic sell-off levels of early October, signaling a calm and controlled rebound. If you’re watching for accumulation, the $2.30–$2.45 range remains structurally sound — think of it as XRP’s safe space in this otherwise volatile dance.

XRP/USDC via Binance 1-day chart on Oct. 25, 2025.
Now, to the oscillators — a suite of mood indicators, if you will. Today, the relative strength index (RSI) clocks in at 50.91, which is as neutral as it gets — XRP isn’t overbought, but it sure isn’t oversold either. The Stochastic oscillator sits at 75.37, hinting at cautious optimism. Meanwhile, the commodity channel index (CCI) lounges at 23.10, reinforcing that “meh” sentiment.
The average directional index (ADX) at 39.87 signals a trend that’s present but not overpowering. The Awesome oscillator on the daily chart on Saturday dips slightly negative at −0.22255, keeping it in neutral territory, while the momentum oscillator flashes some potential at 0.19536. The moving average convergence divergence (MACD) level sits at −0.09677 — but the signal leans constructive. In other words: not thrilled, not panicked — just waiting for the next move.
And finally, the moving averages (MAs) — the heartbeat of any technical analysis. The exponential moving averages (EMAs) and simple moving averages (SMAs) over the 10- and 20-period frames are echoing short-term strength: EMA (10) at $2.477 and SMA (10) at $2.417 both show bullish alignment, as do EMA (20) at $2.540 and SMA (20) at $2.525.
But don’t get too comfortable — the longer-term outlook throws some shade. EMA (30), EMA (50), and EMA (100) all point downward, with values of $2.607, $2.695, and $2.740, respectively. Their simple siblings — SMA (30) at $2.655, SMA (50) at $2.780, and SMA (100) at $2.926 — echo this hesitation. It’s only at the 200-period level where things get confusing: EMA (200) at $2.611 remains pessimistic, while SMA (200) at $2.602 dares to flash a green light. Mixed signals? Definitely. But hey, that’s crypto.
Bull Verdict:
XRP’s multi-timeframe structure still leans upward, even if it’s huffing a bit on the climb. With strong short-term support between $2.45 and $2.50, a push above $2.66 could reignite momentum toward $2.70 and higher. Oscillators are calm, not contrarian, and short-term moving averages are aligned with continuation. In this corner, the bulls haven’t left the ring — they’re just pacing for their next round.
Bear Verdict:
Despite the flashy rebound above $2.60, XRP’s ascent is riding on thinner volume and a series of bearish signals from the longer-term moving averages. The RSI and CCI both yawn in neutrality, and the 200-period EMA still isn’t convinced. If price slips below $2.45 — or worse, breaks under $2.30 — the rally may unwind faster than you can say “retracement.”
- What is XRP’s current price and market cap?
XRP is trading at $2.64 with a market cap of $156 billion. - Is XRP in an uptrend today?
Yes, XRP is trending upward on short-term charts, pushing from $2.43 to $2.64. - What resistance levels should traders watch?
Key resistance lies between $2.66 and $2.70, with $2.75 to $2.80 as the next upside targets. - Are technical indicators showing strength or weakness for XRP?
Short-term moving averages support strength, but long-term signals remain mixed.
Disclaimer: This article represents only the personal views of the author and does not represent the position and views of this platform. This article is for information sharing only and does not constitute any investment advice to anyone. Any disputes between users and authors are unrelated to this platform. If the articles or images on the webpage involve infringement, please provide relevant proof of rights and identity documents and send an email to support@aicoin.com. The relevant staff of this platform will conduct an investigation.