Nvidia will release its quarterly report after the market closes on May 20 (Wednesday) Eastern Time, which serves as a key stress test for the current AI bull market cycle.
The semiconductor sector is severely overbought technically, with options positions heavily skewed towards bullish, and a rare signal of "stock prices rising in sync with implied volatility" makes the two-way risk during this earnings window significantly larger than before.
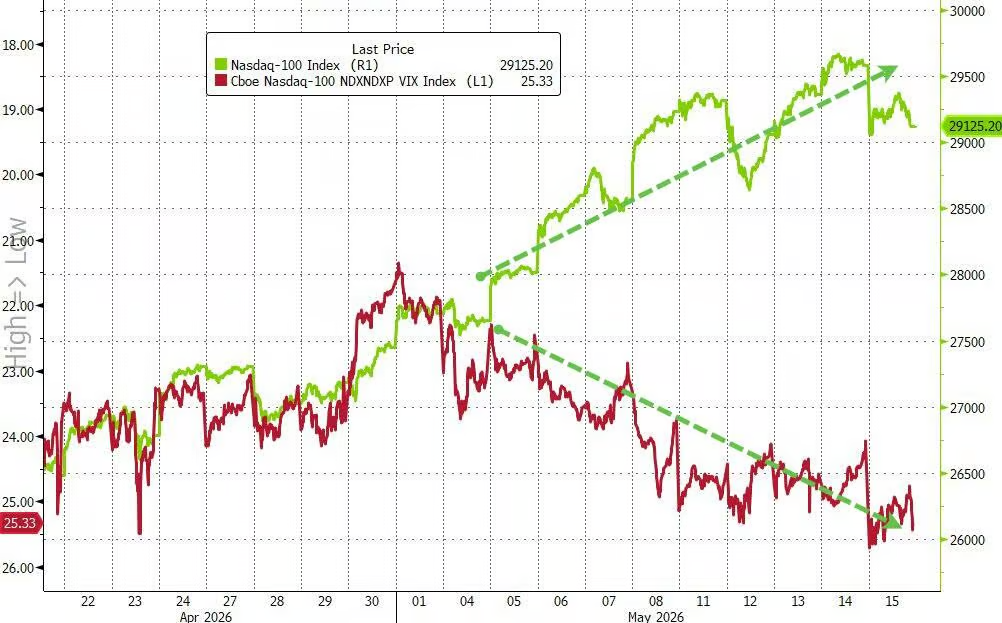
Goldman Sachs TMT chief expert Peter Callahan released a briefing titled "Yellow Light" on Monday, noting that the Nasdaq 100 index (NDX) and the Philadelphia Semiconductor Index (SOX) recorded their first weekly decline of the quarter last week; the 10-year U.S. Treasury yield rose to about 4.60%, marking the largest single-week increase in over a year; oil prices rebounded to around $109 per barrel; and the VIX also increased.
He pointed out thatthe core contradiction faced by the AI and semiconductor themes is that the fundamentals remain strong, while technical pressures continue to accumulate.
Options analysis firm SpotGamma recently pointed out that the market is experiencing a rare "parallel pattern of rising stock prices and simultaneous increasing volatility"—typically, these two should exhibit an inverse relationship. This signal indicates that traders are both chasing upward trends while paying for protection against large volatility.
The implied volatility range for Nvidia's financial report has reached 6%, with market attention highly focused on this time point.
The earnings results and forward guidance will directly test the market's expectations of the AI computing supercycle. Given the high correlation between Nvidia and the semiconductor as well as the broader technology sectors, its performance in the report, whether positive or negative, will trigger widespread market reactions.

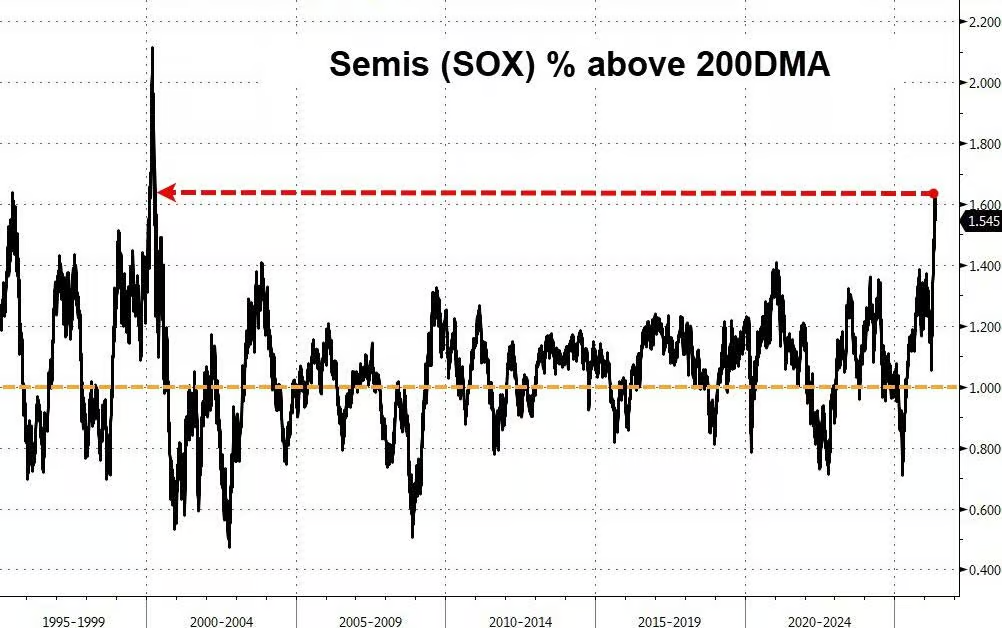
1. Technical indicators send the most extreme warning since 1999/2000
The magnitude and speed of this round of semiconductor gains have pushed technical indicators to historically overbought levels.
Goldman Sachs data shows that the SOX index has risen about 70% since its low at the end of March, adding over $5 trillion in market capitalization along the way.
Driving factors include a phase of easing geopolitical tensions, unexpectedly strong corporate earnings—such as AMAT raising its full-year guidance more than expected, and CSCO's product orders achieving a 35% year-on-year increase—and increased investor confidence in the demand for AI computing power; semiconductor industry profit expectations have been raised by over 25% since the beginning of the year.
However, Peter Callahan specifically pointed out thatthe SOX index is currently about 60% above its 200-day moving average, a divergence not seen since the peak of the 1999/2000 dot-com bubble.
He also noted that Goldman Sachs’ high-momentum factor portfolio has experienced ±5% or more volatility on 12 trading days this year, accounting for nearly 15% of all trading days this year; the rapid expansion of leveraged ETFs and options products has further amplified this two-way elasticity.
"It is worth remembering these tactical dynamics before the earnings season ends this week (Nvidia on May 20) and before summer trading begins," Callahan wrote. Goldman Sachs' trading desk remains constructively positioned on the AI and semiconductor themes in the medium term but advises investors to be cautious of technical challenges on a tactical level.
2. Nvidia’s financial report: Forward guidance may be more critical than quarterly results
The market remains optimistic about Nvidia's fundamental prospects, but the recent stock price performance has somewhat overdrawn some expectations.
According to Goldman Sachs’ forward-looking report on Nvidia’s earnings, analysts generally expect the company's revenue this quarter to exceed market forecasts by about $2 billion—historically, Nvidia's outperforming margins often range from 2% to 3%.
The market is more focused on the forward guidance for the next quarter,where current analyst consensus expectations are around $86 billion, with a quarter-on-quarter increase of about 9%.
Other focal points include whether Nvidia’s cumulative revenue guidance of about $1 trillion for data centers has further upside potential, and the narrative of accelerating demand for Agentic AI inference—especially its planned shipment of pure CPU rack products expected to start in the second half of 2026.
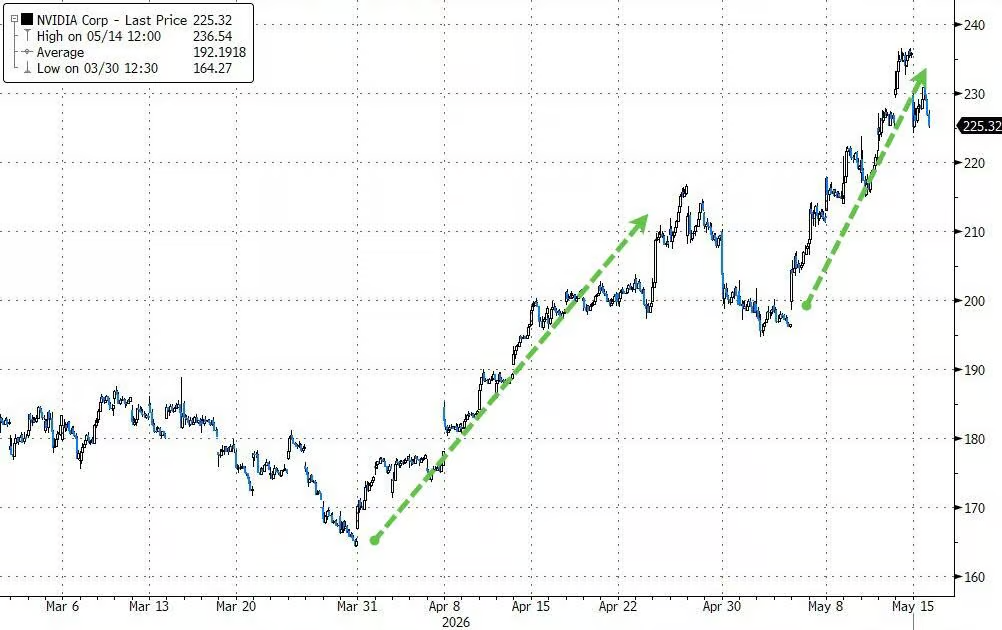
From recent price trends, Nvidia has risen for seven consecutive trading days, with a cumulative increase of 20%, marking the longest consecutive rise in two years; since the low at the end of March, it has added about $1.7 trillion in market capitalization.
However,Goldman Sachs data also shows that in the trading day (T+1) following Nvidia's last five earnings reports, there were declines on four occasions, and since May 2022, significant single-day increases triggered by earnings reports have actually not occurred.
3. Options market: Extreme bullish bets and tail hedging are simultaneously in place
The options position structure shows a set of conflicting signals.
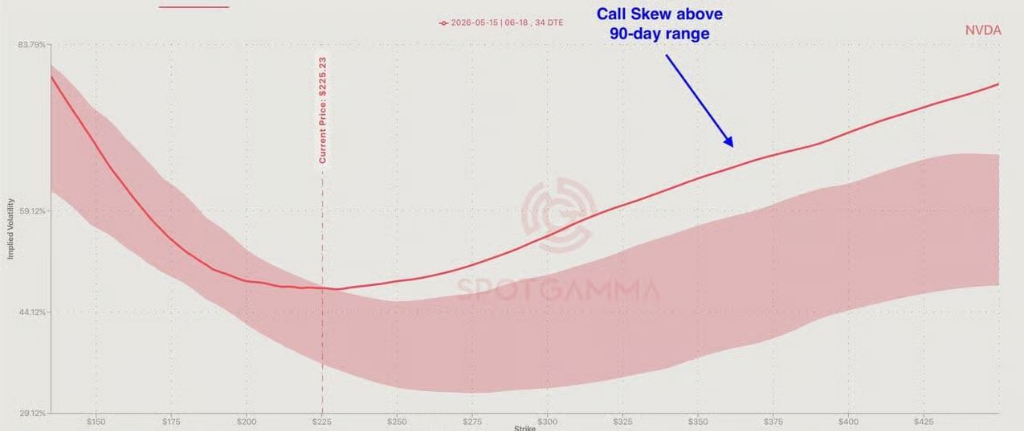
According to SpotGamma data, overall positions remain extremely bullish, with traders continuously rolling Nvidia call options to higher strike prices,while the call skew remains at the high end of the 90-day historical range, and the demand for downside protection is severely limited.
According to 22V Research, last Friday, the nominal trading volume of SP500 call options hit a record high of $2.6 trillion, with calls accounting for as much as 60% of total options trading volume; the Philadelphia Semiconductor Index RSI also rose to its highest level since March 2000.
Meanwhile, hedging against downside risks is also quietly unfolding.
SpotGamma noted that there has been a significant increase in large put option structures and buying activities around the SP500 (SPY), semiconductor ETFs (SMH), and DRAM-related assets, concentrated in deeply out-of-the-money strike price ranges, indicating their function is closer to tail risk hedging rather than simply directional bets. "Market participants are not bearish on Nvidia, but the preparations for downside scenarios are not trivial," SpotGamma wrote in the report, "any directional change will almost certainly ripple through the broader market."
SpotGamma further pointed out thatNvidia has cumulatively risen over 35% since the low in March, and the current size of bullish option positions means that should the earnings report disappoint the market or trigger large-scale profit-taking, a significant directional reversal could occur.
4. Market breadth risk: The rally is being supported by a few stocks
Beneath the strong performance of semiconductors and major tech stocks, the overall participation rate in the U.S. stock market is forming structural concerns.
Peter Callahan pointed out in the report that although the S&P 500 has risen about 8% since the beginning of the year, only about 52% of its constituent stocks have recorded positive returns. Sectors that have significantly lagged this year include residential real estate, medical equipment, construction engineering with government business exposure, federal IT services, software and services, independent power producers, restaurant chains, commercial real estate brokers, and insurance brokers.
Callahan admitted that examining the charts of these sectors makes him wonder whether the current market performance truly reflects overall "health" or is merely the "source of funds" effect of investors being forced to concentrate their funding in a few large-cap AI stocks.
Oppenheimer's stock derivative team also noted that only about one-fifth of S&P 500 constituent stocks have outperformed the index in the past month, while the dispersion index has risen to its highest level in over a year, and implied correlation has approached its lowest point since the beginning of the year.
Goldman's prime brokerage department (PB) latest data also shows that the technology sector has recently shown a significant "risk withdrawal" action.
Disclaimer: This article represents only the personal views of the author and does not represent the position and views of this platform. This article is for information sharing only and does not constitute any investment advice to anyone. Any disputes between users and authors are unrelated to this platform. If the articles or images on the webpage involve infringement, please provide relevant proof of rights and identity documents and send an email to support@aicoin.com. The relevant staff of this platform will conduct an investigation.