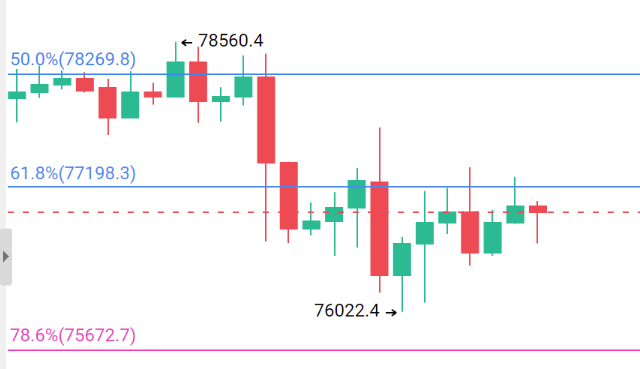
The market quickly dropped from the high point of 78560.4, with consecutive large bearish candles directly breaking through the key Fibonacci 50% and 61.8% retracement levels, with bearish momentum being concentrated and the bulls showing no resistance, making the downtrend completely dominant at one point.
After dipping to the stage low of 76022.4, the price entered a rebound phase, with multiple red and green K lines repeatedly fighting near the 61.8% retracement level (77198.3), with trading volume also showing a shrinking state.
This indicates that the bearish momentum is temporarily exhausted, and selling pressure has eased, but the bulls also lack the strength to break through key resistance, leaving the market in a typical continuation of the downtrend oscillation, with direction yet to be clarified.
Weak continuation projection: If the price remains under pressure at the key resistance level of 77198.3 without forming an effective breakthrough, it is highly probable that it will test the stage low of 76022.4 again;
Once this support is broken, the downtrend will continue, with the next target looking towards the 78.6% retracement level of 75672.7.

Disclaimer: This article represents only the personal views of the author and does not represent the position and views of this platform. This article is for information sharing only and does not constitute any investment advice to anyone. Any disputes between users and authors are unrelated to this platform. If the articles or images on the webpage involve infringement, please provide relevant proof of rights and identity documents and send an email to support@aicoin.com. The relevant staff of this platform will conduct an investigation.