
Academician of the Coin Circle: Is Ethereum (ETH) on July 21 seemingly calm but actually turbulent? Latest market analysis reference
Current price of Ethereum is 1900, with a previous surprise rebound from 1503 and a helpless fall after hitting resistance at 1983, many people have been repeatedly washed in this fluctuation, both long and short facing hardships. But as long as you grasp the rhythm behind the candlesticks, you don't need to chase highs and cut losses; you can find your own safe range amid the fluctuations. Today, I will use two charts to thoroughly explain the current trends, support and resistance levels, and entry signals to help you avoid the easiest traps
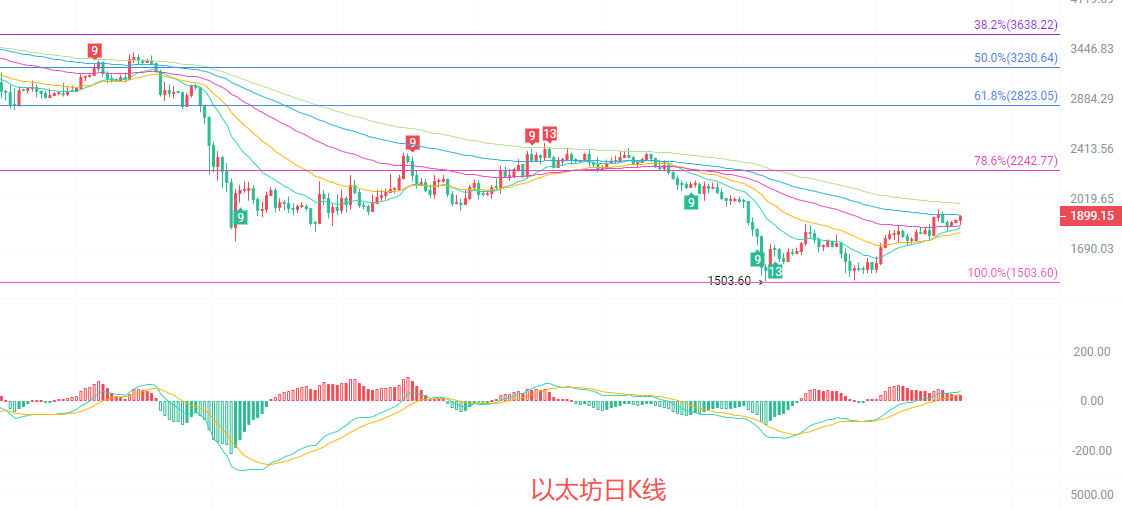
The daily candlestick is at a critical contest point, with the current price stabilizing above the EMA15, EMA30 and other moving averages, and the mid-Bollinger band at 1799 providing support, overall showing a repairing and fluctuating situation. The MACD indicator shows a golden cross between DIF and DEA moving upwards, with red bars continuing to expand, bullish momentum has not yet diminished. However, the resistance near the 78.6% Fibonacci retracement line at 2242 around 2000 combined with the previous high point at 1975 creates dual pressure, making short-term upward movement face tests. The strong support level lies at 1840; if broken, it may test the 1700 range.
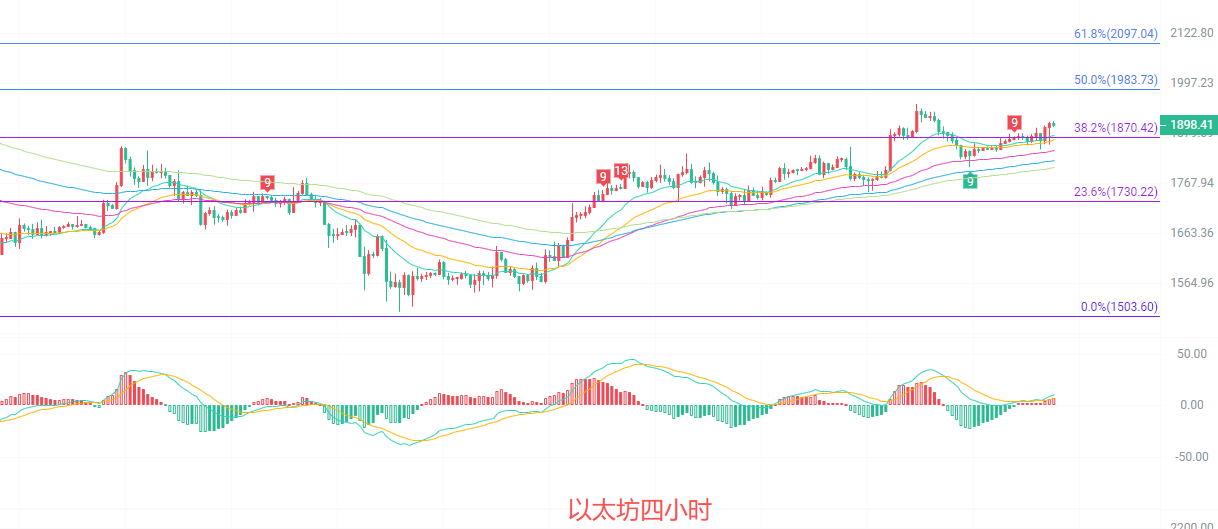
The four-hour candlestick is operating above the mid-Bollinger band at 1862, with the Bollinger band opening slowly expanding. The price is fluctuating upwards along EMA15 and EMA30, with the moving averages arranged bullishly providing support for the short-term trend. The MACD red bars are continuing to shrink, with DIF and DEA sticking at a high, showing that bullish momentum is somewhat diminishing. The previous high points near 1983 and 1903 form a short-term pressure zone, and 1870 below is the key support. If this position is broken, it is highly likely to initiate a pullback trend.
Short-term reference:
If the lower range of 1850 to 1800 is not broken upwards, stop loss at 1760, target looking at 1930 to 1970
If the upper range of 1980 to 2020 is not broken downwards, stop loss at 2050, target looking at 1930 to 1890
Specific operations should be based on real-time market data. For more detailed information, you can inquire with the author. The article publication has a delay, and suggestions are for reference only; risks are borne by oneself.

Kind reminder: The above content is solely created by the author of the public account. The advertisements at the end of the article and in the comment section are unrelated to the author, please discern carefully, thank you for reading
Disclaimer: This article represents only the personal views of the author and does not represent the position and views of this platform. This article is for information sharing only and does not constitute any investment advice to anyone. Any disputes between users and authors are unrelated to this platform. If the articles or images on the webpage involve infringement, please provide relevant proof of rights and identity documents and send an email to support@aicoin.com. The relevant staff of this platform will conduct an investigation.