Hotcoin Research | The Exit of Established Exchanges and On-Chain Signals Reaching the Bottom: How Far Is the Crypto Market from a Turning Point?

CN
Hotcoin
12 days ago

Introduction

Since July 2026, the crypto industry has experienced a series of exits and shutdowns: AscendEX ceased operations on July 1; BitMEX, which pioneered the era of high-leverage perpetual contracts, announced it would close its exchange on September 23; BitMart, which had operated for nine years, also initiated an orderly shutdown on July 26 and plans to cease platform operations by the end of January 2027. Meanwhile, protocols and projects such as Zero Network, Everclear, Syndicate Labs, and Fantasy.top have successively stopped operations or entered contraction phases.

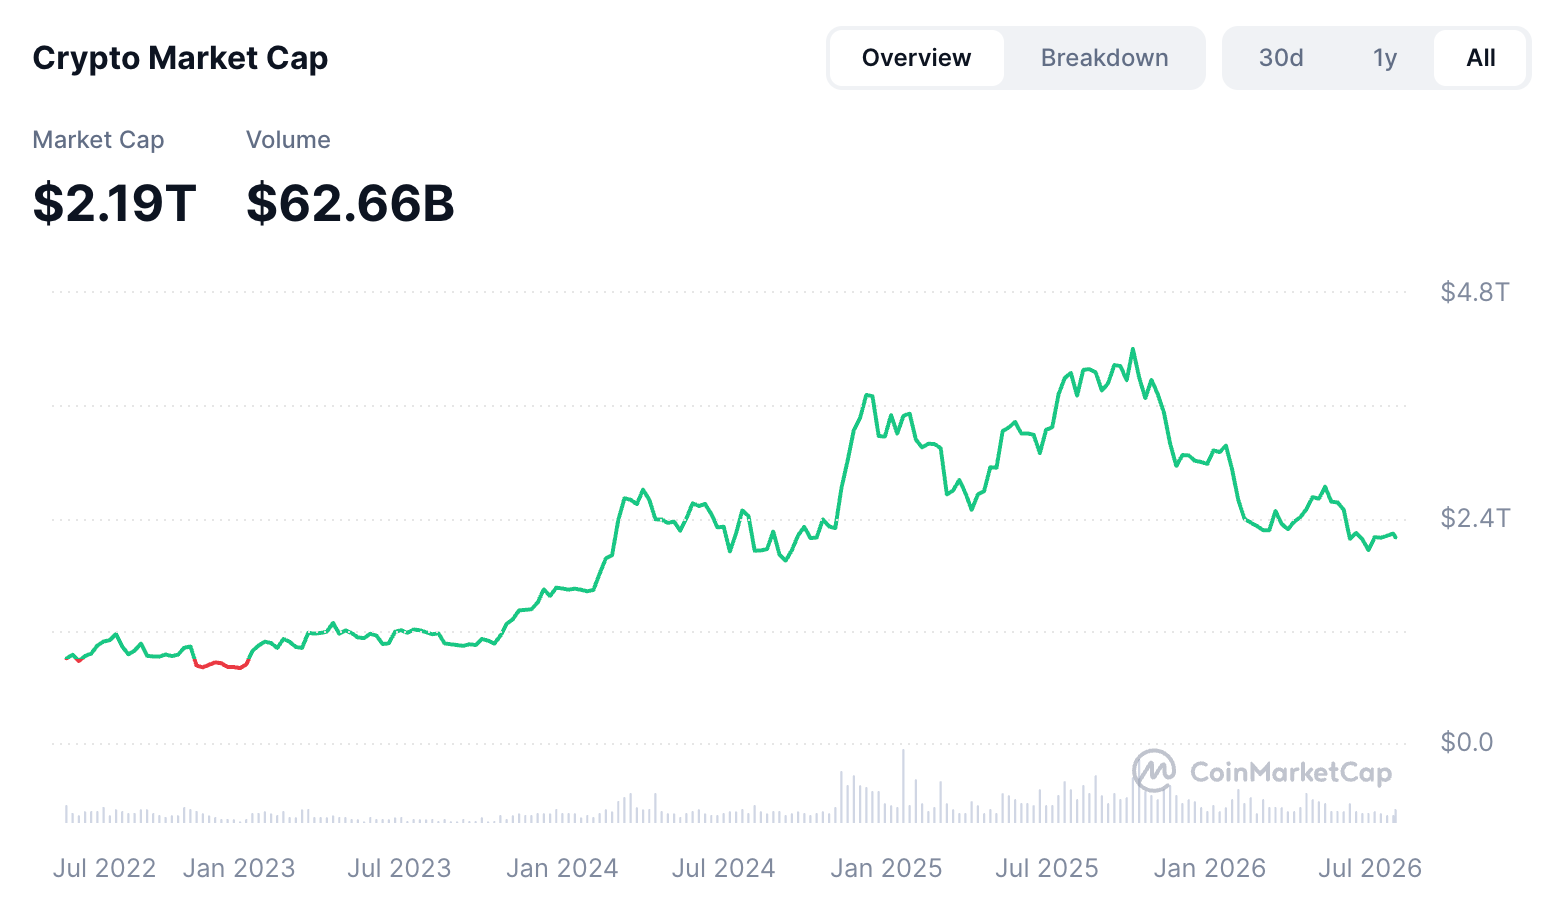
This wave of exits comes after nearly ten months of market adjustments. BTC reached a cycle high of about $126,236 on October 6, 2025, and then fell to a low of about $57,740 in July 2026, representing a maximum drawdown of approximately 54%. According to CoinMarketCap data, the total market capitalization of the crypto market also fell from a high of about $4.2 trillion in October 2025 to a low of about $2.04 trillion in July 2026, a decline of over 50%. Prices, trading volumes, financing, and the number of projects have simultaneously contracted, truly exhibiting characteristics of a “concentrated liquidation” phase in the latter part of a bear market. The question remains: Are the shutdowns of exchanges and projects a signal that the cycle is nearing its bottom, or are they a result of deteriorating industry demand?

Source: https://coinmarketcap.com/charts/

1. The Significance of the Shutdown Wave: Bear Market Pressure has Transmitted to the Operational Side of the Industry

Asset prices usually reflect expectations first, while operational issues for businesses often expose themselves several months or even a year later. Exchanges can rely on previously accumulated transaction fees, and projects can temporarily sustain operations through financing and token reserves. Therefore, platform shutdowns are typically a lagging result following the contraction of income, interruption of financing, and accumulation of cost pressures. Currently, the exiters are no longer just small projects lacking users, but include established trading platforms that have operated for many years and once held a clear position in the industry.

1.1 Three Established Exchanges Shut Down: Size and History Are No Longer a Safety Net

AscendEX, BitMEX, and BitMart announced their shutdowns in July, but their stories are not the same. Regulatory pressure, loss of market share, and declining operational efficiency constitute different exit logics. What is truly worth noting is not who falls first, but that the conditions on which trading platforms rely for survival have changed: merely operating long enough, having sizeable trading volumes, or even defining industry products no longer guarantees a stable passage through the cycle.

AscendEX illustrates that regulation is not an external variable beyond the bear market: After the decline in income, licensing, auditing, anti-money laundering, and localized teams become heavier fixed costs. BitMEX shows that inventing a product does not equate to permanent market dominance; when perpetual contracts become standard in the industry, the competitive barriers shift to liquidity, user entry points, and risk systems. BitMart illustrates that trading volume does not equal operational health; platforms also bear responsibilities for market making, compliance, customer service, and withdrawal pressure. Only trades that can be converted into sustainable fees and user retention are commercially meaningful.

Thus, the exit of these three platforms cannot be simply attributed to “the bear market leading to exchanges going bankrupt.” The core message released by the sequential exits of established platforms is not that all exchanges are in a payment crisis but that the industry’s safety net is thinning: history can only prove that a platform once succeeded; only continuous cash flow, credible payment capabilities, and compliant operations can determine whether it can stay at the table.

1.2 The Number of Project Closures Exceeds a Hundred, but “Death” is Not a Uniform State

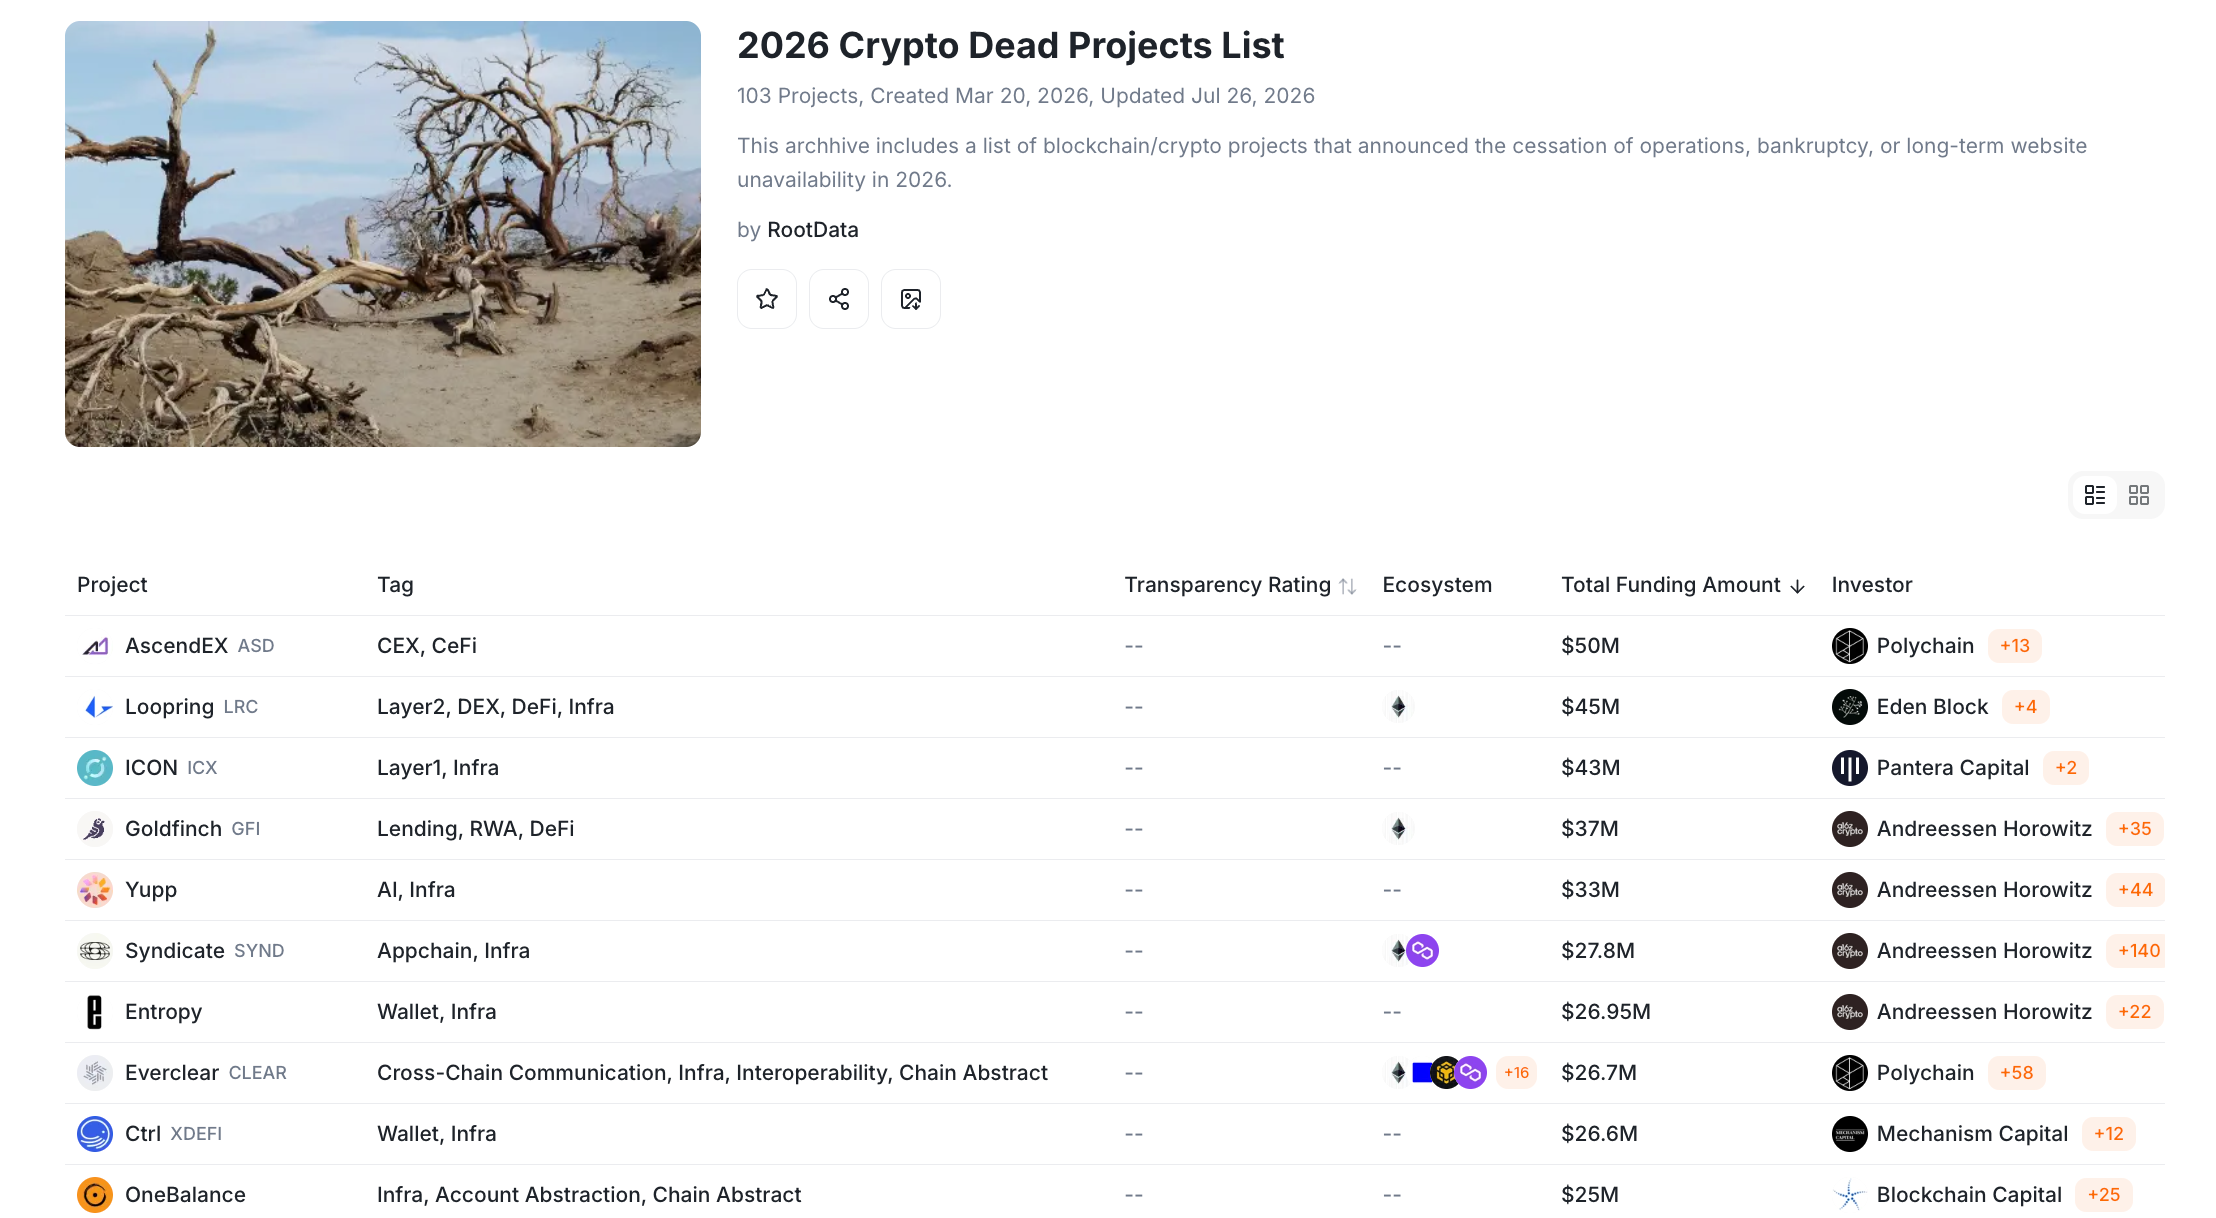
According to RootData, the “Crypto Dead Projects List” for 2026 contains 103 projects. This number sufficiently indicates that the speed of industry elimination is accelerating.

Source: https://www.rootdata.com/archives/detail/

RootData’s statistics encompass projects that have formally announced shutdowns, entered bankruptcy proceedings, become long-term inaccessible, or have had products cease operations for an extended period; the actual status varies significantly. For example, Zero Network entered shutdown after about a year and a half of operation; Everclear closed its core frontend, protocol, foundation, and research organization; Syndicate Labs acknowledged that Rollup infrastructure struggled to find enough clients; Fantasy.top found that crypto card games attracted speculators rather than stable players. The common issue among these cases is not the lack of narratives but the absence of real demand and revenue sufficient to cover development costs.

Other cases cannot simply be categorized as “death.” Balancer Labs closed its company entity following a $110 million security incident, but the protocol plans to reduce products, discontinue existing incentives, and continue operating; ICON Network will close its old chain by the end of the year and migrate assets and functionalities to SODAX. The former is a restructuring, and the latter is a migration, which does not imply the entire ecosystem is reduced to zero.

1.3 The Shutdown Wave Is a Signal for the Latter Half of the Bear Market but May Still Create New Selling Pressure

Historically, corporate shutdowns typically occur after significant price declines. Projects at the peak of a bull market have higher token reserve valuations and financing capabilities; even without cash flow from products, they can rely on token unlocks, foundation grants, or venture capital to sustain for years. As prices fall, financing valuations shrink, and market depth declines, the problems originally masked by asset appreciation become focused and exposed.

This gives the shutdown wave a clear lagging characteristic. It indicates that the previous round of expansion is undergoing liquidation but does not provide an accurate timeframe for the price bottom. Instead, the process of platform exits may increase market pressure in the short term: exchanges need to close positions, project teams may sell treasury assets, and investors may seek to redeem and move funds. Platform tokens and project tokens may also face concentrated selling due to collapsing expectations. Liquidation represents long-term supply contraction but may initially cause a round of short-term selling pressure.

True signals nearing the bottom are not marked by increasing bad news but rather by diminishing marginal impacts of bad news on prices. If new shutdowns, attacks, or regulatory pressures emerge but BTC does not create new lows, it indicates fewer sellers and that long-term funds are beginning to absorb selling pressure.

2. Market Structural Changes: Funding Is No Longer Buying Growth Without Cash Flow

The deeper change behind the shutdown wave lies in the restructuring of capital supply, liquidity distribution, and user demand in the crypto industry. In the last cycle, numerous projects relied on subsidies to obtain TVL, airdrops to increase address counts, and token price increases to cover real losses. When external funding recedes, the market starts to reassess fundamental questions: Who is using the product? Who is willing to pay? Can income cover safety, compliance, and development costs?

2.1 The Revenue Chain Transmission Path of Size and Price Contraction

The market shift observed in October 2025 first manifested as a drop in asset prices and leveraged positions. Data from TokenInsight indicates that the tariff shock in October 2025 triggered about $19 billion in liquidations, after which the exchange industry entered a phase of sustained deleveraging. In the first quarter of 2026, the total trading volume of 20 major exchanges fell to $17.9 trillion, a quarter-over-quarter decrease of 32% and a 42% decline compared to the cycle high of $31 trillion in the third quarter of 2025. Among this, derivative trading volume dropped to $14.6 trillion, and spot trading volume fell to $3.3 trillion, both reaching multi-quarter lows.

Price declines and trading volume reductions transmit along the revenue chain: exchanges face reduced fees but still must bear costs for systems, security, customer service, market making, and compliance; projects encounter treasury shrinkage, worsening financing conditions, and failed incentives; venture capital firms tighten subsequent financing due to reduced exit channels, ultimately forming a chain of “price decline – trade shrinkage – revenue drop – financing tightening – team reduction – product closure.”

Many projects that gained three to five years of funding during the financing peak of 2021-2022 are now entering an exhaustion window by 2025-2026. Without establishing revenue, teams must choose between raising valuations through financing, selling at low prices, pivoting to AI, or shutting down. The bear market acts as an accelerator, and what truly determines survival is the unit economic model.

2.2 The Industry Enters a Phase of “Fewer Projects, Greater Integration”

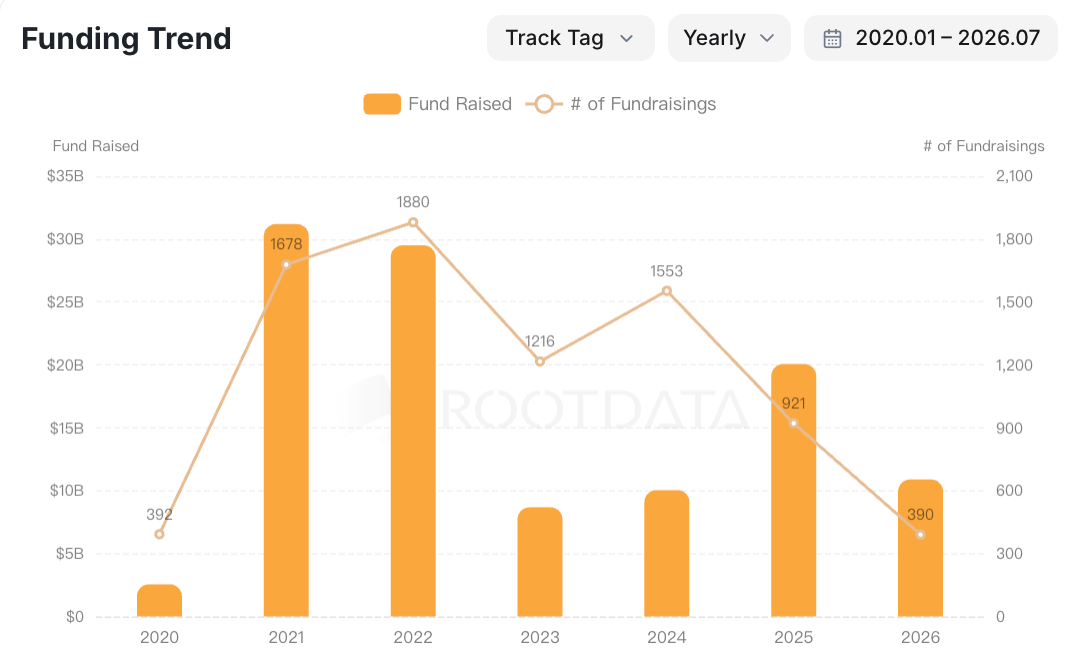
RootData's statistics on over 20,000 projects show that after entering 2026, the number of new projects each month does not exceed 80, nearing levels before August 2020. The number of financing events has declined for three consecutive years, marking the longest financing contraction cycle recorded in the crypto industry. Even when BTC hit new highs in 2025, it did not reinvigorate extensive primary market expansion.

Source: https://www.rootdata.com/dashboard

The significant difference in this cycle compared to previous ones is that BTC hitting new highs does not automatically lead to a broad surge across all sectors. Funds are now more concentrated on stable coins, payments, trading infrastructures, prediction markets, and RWA, and are unwilling to continue subsidizing homogenized projects under the logic of “subsidies first, then growth.”

On the other hand, merger and acquisition activities are heating up against the trend. According to RootData, the crypto industry completed 267 mergers and acquisitions in 2025, a year-on-year increase of over 50%; in the first half of 2026, 75 transactions were completed amounting to over $9 billion. The simultaneous occurrence of reduced financing and increased mergers indicates that capital is shifting from “creating more projects” to “acquiring existing users, licenses, teams, and infrastructures at lower prices.” This is not the industry ceasing to develop but a shift in expansion strategies from venture capital-driven to industry-integration-driven.

2.3 Liquidity Concentrates to Leading Platforms

Statistics from TokenInsight show that in the first quarter of 2026, the top five exchanges accounted for 72.17% of total trading volume, with even higher concentration in the derivatives market. In addition, on-chain perpetual platforms such as Hyperliquid are beginning to emerge as true competitors in terms of capital retention and position sizes.

The exit of BitMEX is a reflection of this structural change. The products it created are still thriving, but the products themselves have become highly standardized. Users are now comparing not who launched perpetual contracts first, but who can provide more assets, lower trading costs, deeper liquidity, better mobile experiences, and more transparent asset and risk management. Past innovation accolades cannot replace current user networks.

Security, regulation, and centralization are not new issues arising in 2026, but during bull markets, high incomes can temporarily cover these costs. The bear market primarily eliminates projects where “risk costs exceed sustainable revenues.” Even if the code is open source and the narrative grand, without paying users, it cannot bear auditing and development costs in the long term. The core of this round of cleansing is that capital is re-evaluating cash flow, user retention, and risk-bearing capacities.

3. Signals of Approaching Bottom Are Increasing, but Confirmation of Bottom Has Not Been Completed

Commercial cleansing addresses the question of “whether industry supply has begun to contract,” while the price turning point depends on “whether marginal sellers have exhausted and whether marginal buyers are returning.” Judging whether the market has bottomed cannot rely on a single indicator. RSI oversold conditions can persist for several weeks, MVRV entering low zones may continue to decline, and negative funding rates may more likely be a temporary crowded short position. A more effective approach is to break the bottom down into different levels such as valuation reset, leverage clearance, holder surrender, and demand restoration, and observe whether they resonate.

3.1 Valuation Has Entered Low Levels, but a Historical Level of Comprehensive Surrender Has Not Occurred

As of July 30, 2026, BTC was approximately $64,394, down about 49% from its high of about $126,236 on October 6, 2025. The current cycle's lows touched $57,740, representing a maximum drawdown of about 54%. This extent has exceeded a typical bull market correction but remains less than the more than 70% declines in complete bear markets in 2018 and 2022. The shallower retracement may be attributed to ETFs and institutional funds altering holdings or may indicate the market has yet to undergo a final round of surrender.

On-chain valuations have noticeably cooled. Data from Axel Adler Jr. as of July 30 shows that BTC's MVRV is approximately 1.21, below its historical median of 1.62 and below the 365-day average of 1.59. MVRV (Market Value to Realized Value) is used to measure the current market price relative to the collective on-chain cost of all holders; an MVRV of 1 means that BTC's market value equals the collective cost of all holders. Currently, 1.21 indicates that the market overall still has about 21% of paper profit buffer, which is close to the cost area but has not yet fallen below 1 as seen in some periods of 2015, 2018, and 2022.

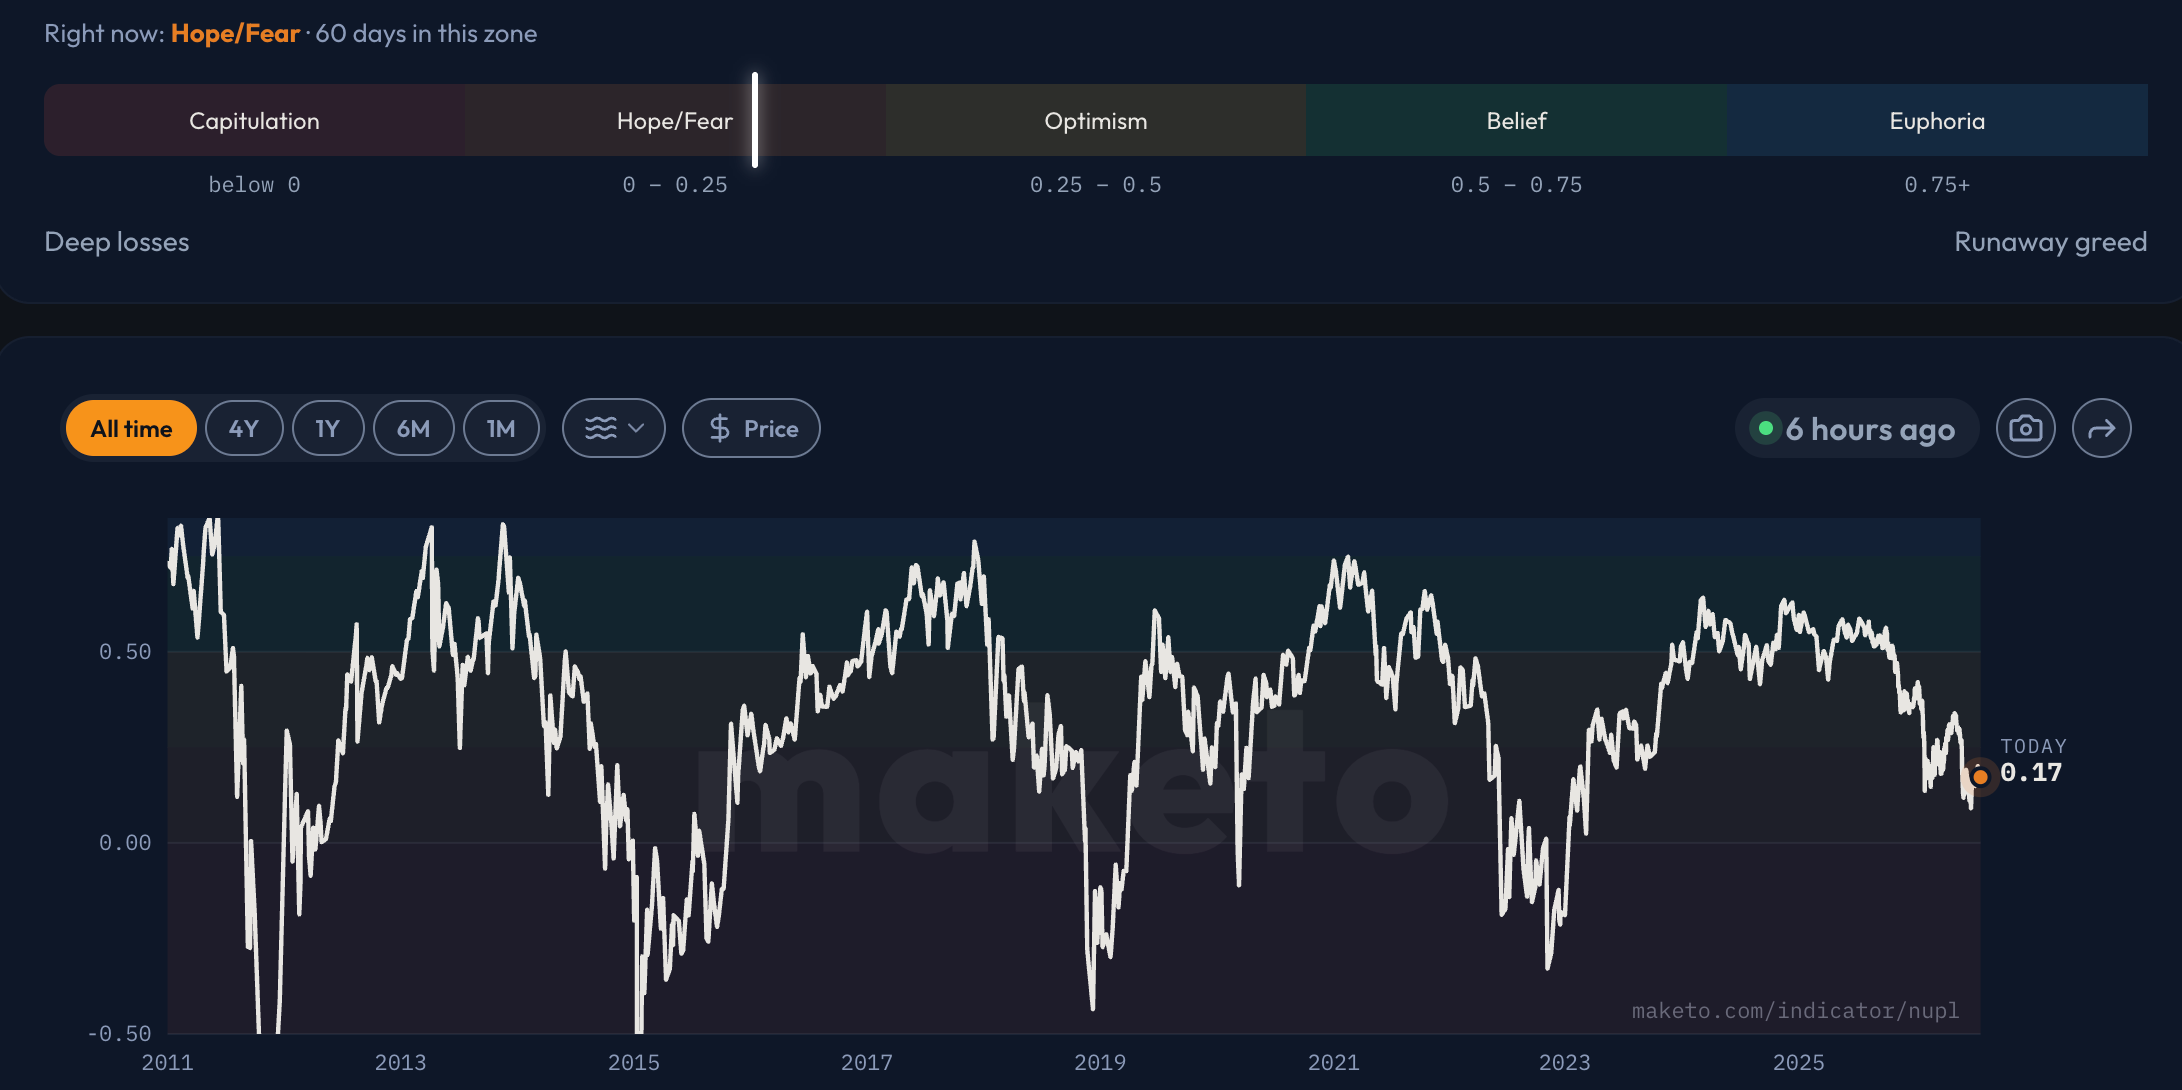
BTC NUPL (Net Unrealized Profit/Loss) is about 0.17, sitting in the “hope/fear” range, indicating that the market overall has only a thin amount of unrealized profits. Meanwhile, as of July 30, about 53.7% of BTC supply is in profit, nearly balanced between profit and loss; over the past four years, only about 12% of the time has been below this level. These data support the judgment that “valuations have entered the latter stage of the bear market” but do not indicate that holders of the entire network are universally in deep losses.

Source: https://maketo.com/indicator/nupl

3.2 Leverage Has Cleared Significantly, but There Are Signs of Resuming Accumulation

To determine whether the market is approaching a bottom, one must not only consider the price decline but also examine whether leverage has been sufficiently released. According to CoinGlass data, as of June 30, 2026, the total size of open derivatives contracts across the market is approximately $99.9 billion, down 17.9% from the beginning of the year; during the first half of the year, derivative trading volume decreased by 15.7%. This indicates that the market has undergone significant passive deleveraging, but the decline in open contracts has not significantly outpaced trading volume, with many risky positions remaining in the market.

Entering July, leverage did not continue to contract unilaterally. As of July 28, BTC futures' open contracts were approximately $47.54 billion, an increase of 6.83% compared to 30 days prior; ETH's open contracts were approximately $26.89 billion, with a 19.42% increase. The funding rates for BTC and ETH remain close to neutral, suggesting that the market has not formed extreme one-sided crowding, and the new leverage added is still very sensitive to price pullbacks.

Thus, a more accurate assessment would be: the previous round of high leverage has been significantly compressed, but the market began to add leverage again in July. A true healthy cyclical turning point should first restore the basic cycles of spot trades, ETF funds, and stablecoin supply, which should then lead to moderate growth in open contracts; if contract positions continue to grow faster than the inflow of spot funds, the market may appear to be exiting the bottom, but in reality may just be re-accumulating the next round of liquidation risks.

3.3 Miners and Holders Are Under Pressure, Yet There Is No Uniform Surrender Signal

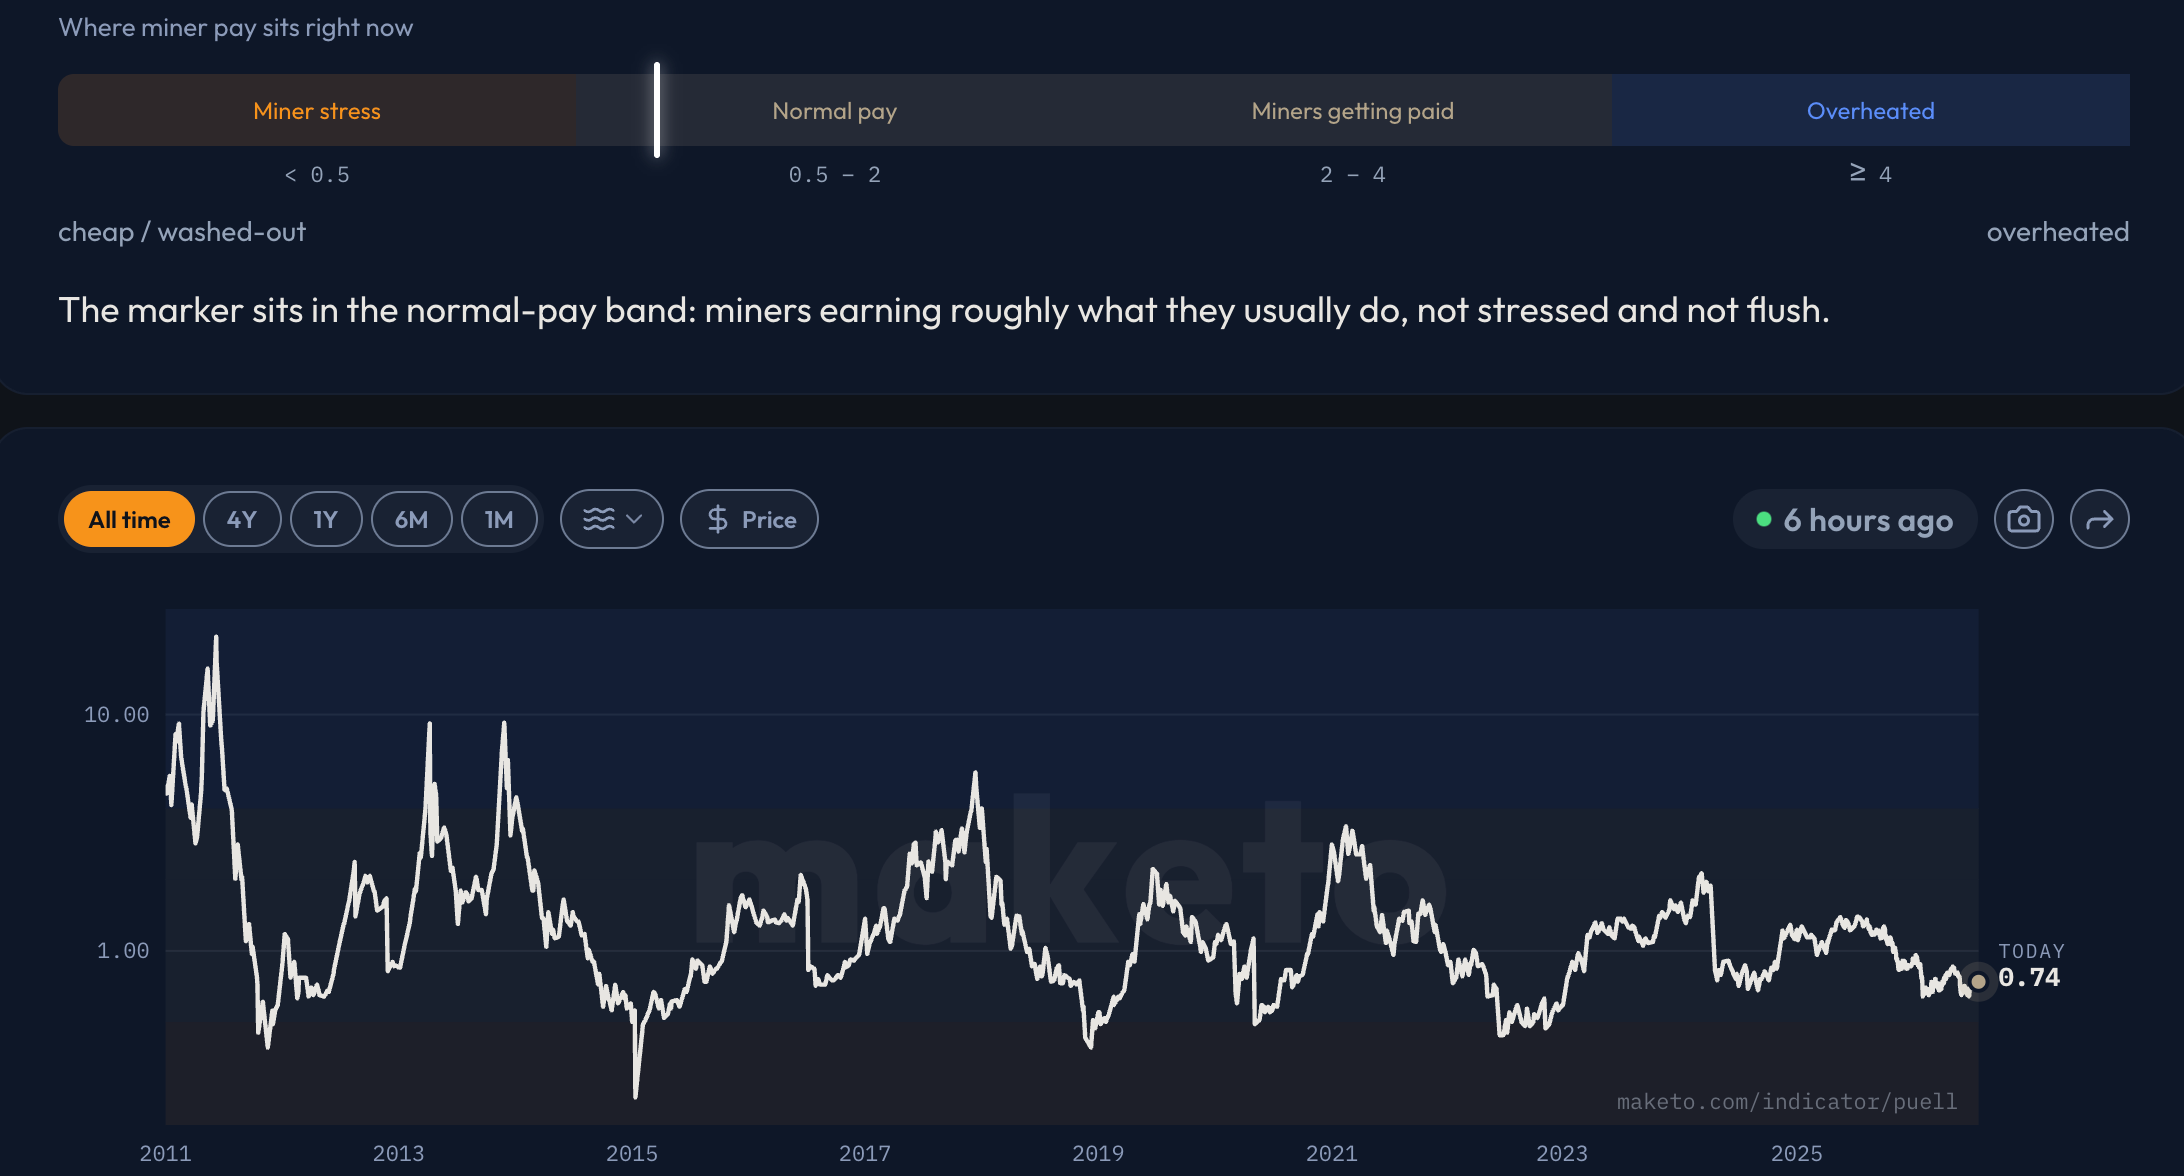
Miners are the group most closely resembling “forced sellers” in the crypto market, needing to use BTC income to pay for electricity, equipment, and financing costs. The Puell Multiple, which expresses the dollar value of daily new BTC divided by the 365-day average, indicates that lower values represent weaker miner income compared to historical levels. On July 30, this metric was about 0.73, in a lower range over the past four years, yet still above 0.5, which is often regarded as an extreme pressure zone historically.

Source: https://maketo.com/indicator/puell

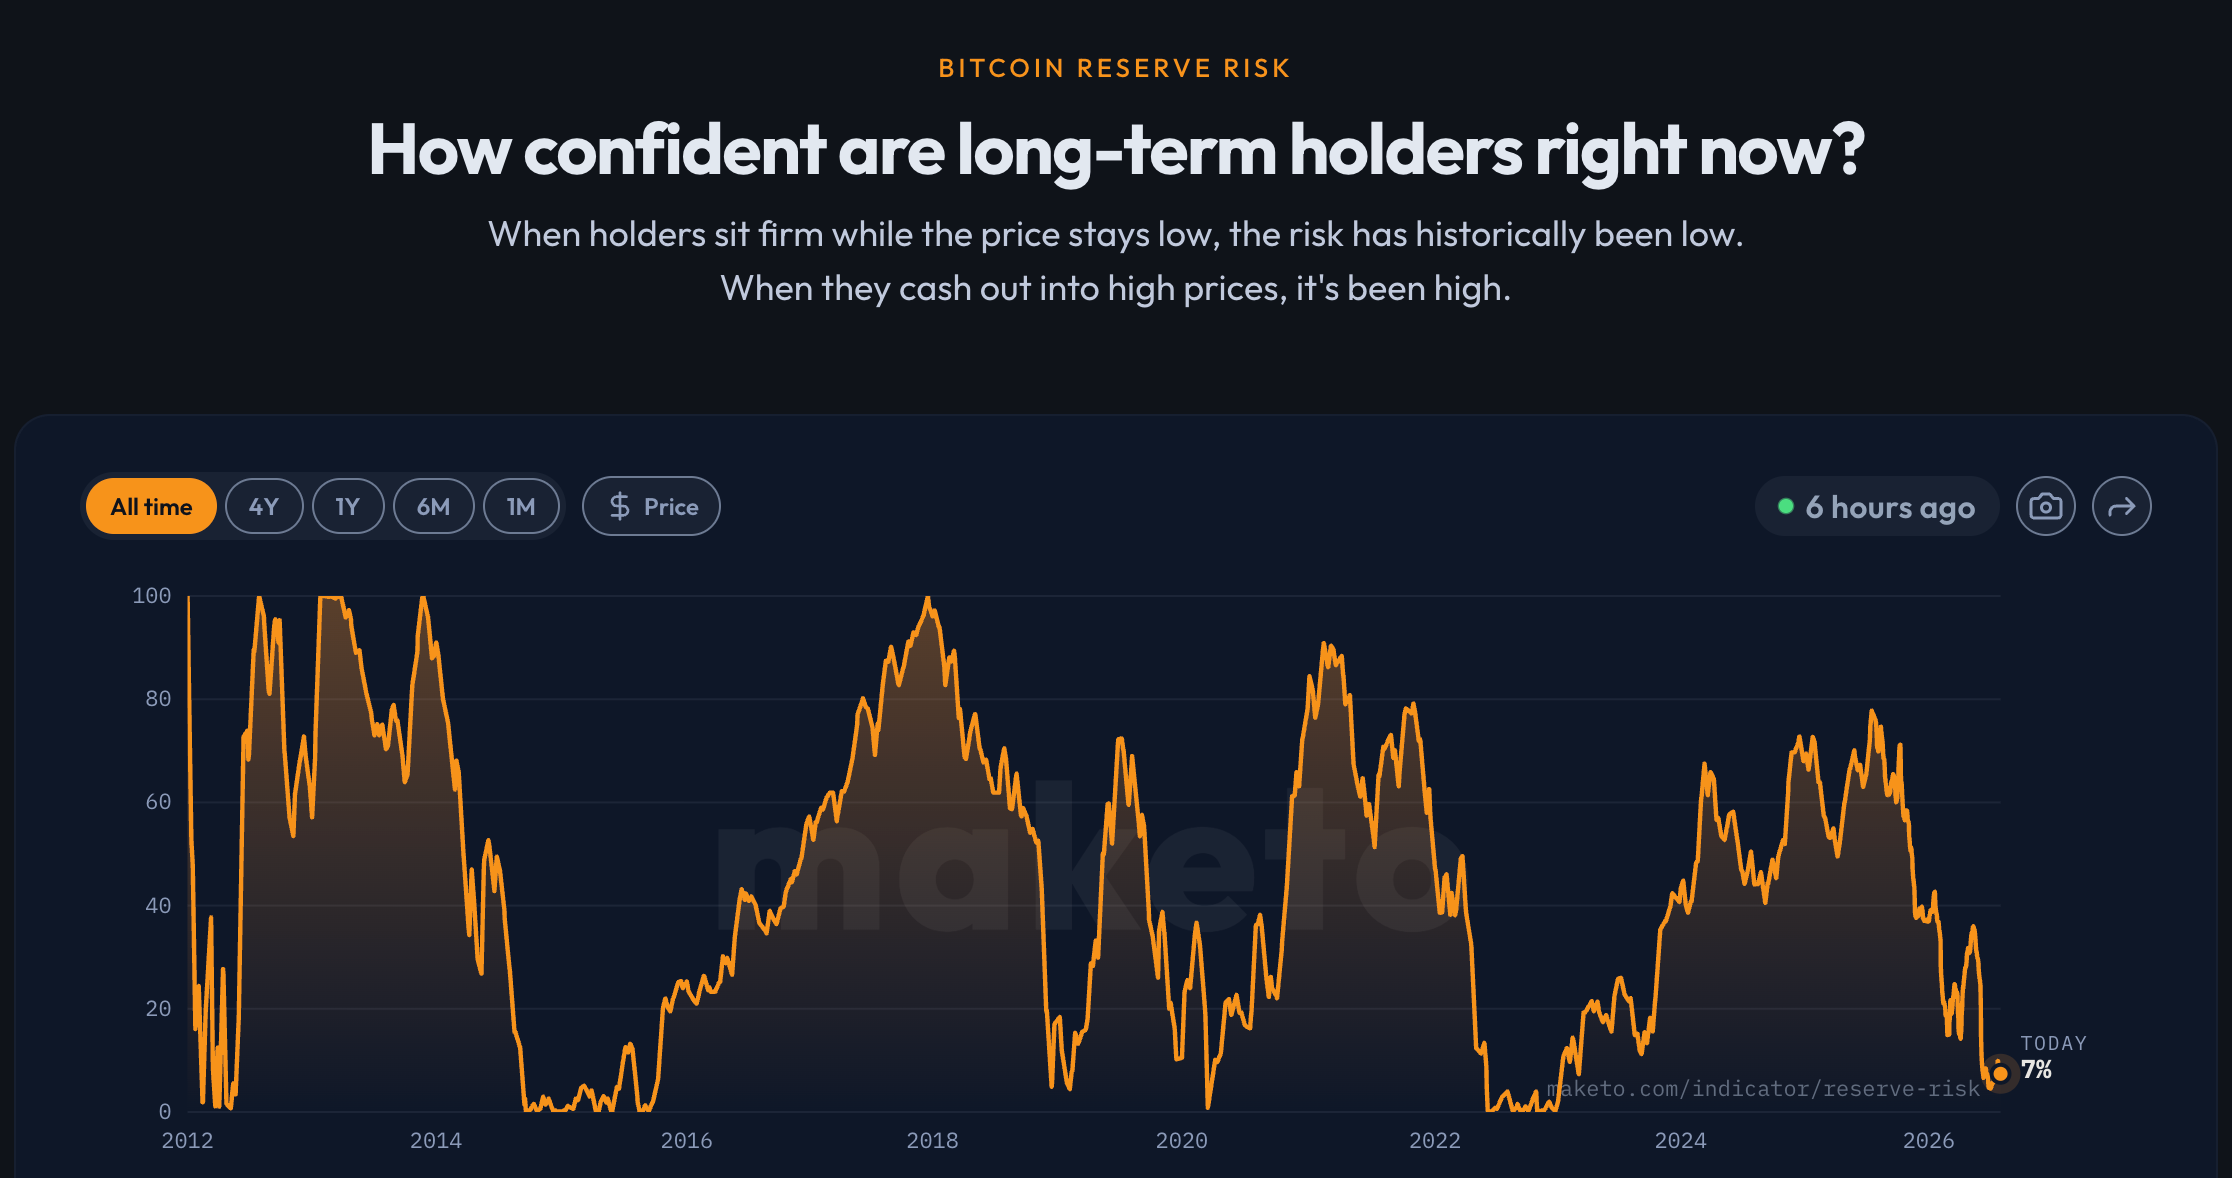
Long-term holders' behavior provides another set of evidence for “the market is bottoming.” Currently, the Reserve Risk has fallen to approximately 7% percentile over the past four years. This metric essentially measures the relationship between BTC's current valuation and the conviction of long-term holders holding their coins: lower values typically indicate a weaker willingness of long-term holders to realize profits, and market prices relative to their holding beliefs are lower. From this perspective, after substantial retracements, BTC has not seen a mass exodus of long-term funds; instead, more tokens are still locked in low-turnover accounts.

Source: https://maketo.com/indicator/reserve-risk

In summary, the market is currently experiencing a typical bottoming differentiation: miners are reducing investments or selling assets due to cash flow pressures, short-term holders are bearing losses amid the pullbacks, while long-term holders continue to hold. Tokens are gradually shifting from participants with higher costs and weaker confidence to those with longer holding periods. This resembles a continuous supply-cleansing process rather than all sellers surrendering at once. It suggests that potential selling pressure is weakening but is still insufficient to confirm that a trend reversal has occurred—contraction on the supply side is merely a prerequisite for bottom formation; a true turning point still requires new demand to seize pricing power.

3.4 Signs of Recovery on the Demand Side Exist, but Sustained Expansion Has Not Yet Been Formed

The bottom ultimately needs confirmation from buyers. The U.S. spot BTC ETF saw a total net inflow of approximately $172.6 million over the 19 trading days before July 2026, with 11 days of net inflows and 8 days of net outflows. Mid-July saw recurring fund inflows, followed by consecutive net outflows on the 23rd, 24th, 27th, and 28th. This indicates that institutional funds are beginning to allocate at low levels but remain in a volatile state without forming a continuous one-sided inflow similar to the bull market phase.

Stablecoins also present mixed signals. In 2026, the total supply of stablecoins briefly rose to about $320.4 billion in May, then retreated to about $306.5 billion by the end of July. Stablecoins serve as settlement funds in the crypto market and potential “cash positions,” with declines in supply implying that some funds are leaving the on-chain system or being redeemed, suggesting that the foundation of demand has not fully recovered. Nevertheless, the scale of stablecoins remains significantly higher than in the previous bear market, indicating that payments, cross-border settlements, and on-chain funds management have created more stable demand than pure trading.

In late July, significant BTC transactions were concentrated between $63,200 and $67,000, with on-chain costs forming a thicker token band around $62,400 to $64,300; pressure remains apparent above $81,400 to $85,000. Only by breaking through the upper region—while achieving realization market value, ETF inflows, and stablecoin supply growth together—can it be shown that new funds are taking over existing turnover.

Overall, BTC has begun to exhibit several characteristics typical of the latter part of a bear market: valuations reverting to low levels, pressure on miners and short-term holders, long-term funds still locking in tokens, and signs of phase-in flows in ETFs. However, these signals mainly indicate that selling pressure is diminishing rather than a new round of growth has commenced. Stablecoin supply has not yet resumed expansion, institutional fund inflows remain volatile, and there has not been effective breakthrough of the upper token pressure. Thus, the current situation is more fittingly defined as a “bottom formation period” rather than a “bottom confirmation point”: the market is nearing critical regions of cost and confidence, but the true trend reversal still requires continued new funds to replace existing turnover.

4. How to Navigate the Cleansing Cycle: Platform Competition Shifts to Comprehensive Operational Capabilities

The exitters reveal issues within the industry, while survivors highlight the competitive rules for the next stage. Stable operation of platforms during a bear market cannot rely solely on past branding or reported trading volume. True cyclical navigation capability comes from three aspects: whether fixed costs and risks can be controlled, whether product adjustments can follow user demand, and whether the basic cycles of users, liquidity, and income can be maintained even in a market downturn.

4.1 The Future Platform Barrier is a Combination of “Liquidity, Trust, and Product Responsiveness”

In the past, small and medium exchanges could attract users through rapid listing and high commissions, but more assets also mean higher costs for wallets, risk control, market making, and compliance; when long-tail assets lack genuine trading, quick listings can create liquidity fragments. Platform competition has shifted from “whether there are products” to “whether a full suite of services can be reliably delivered”: spot trading requires depth and filtering, derivatives require price marking, risk preparation, and clearing systems, global operations demand local payment and compliance, while new assets must explain the differing rights boundaries of Meme, AI, Pre-IPO, and TradFi products.

From an operational perspective, platforms must pass at least four tests: First, core trading pairs must maintain genuine depth during extreme market scenarios; second, user asset isolation, reserve disclosures, and withdrawal processes must withstand pressure; third, new products should contribute to retention and fees rather than just generate one-time trades; fourth, compliance, security, and technology costs should not consume all revenue. The bear market has put these four capabilities on display simultaneously, making growth sustained solely through subsidies or long-tail listings increasingly challenging.

Leading CEXs expand their advantages through scale and comprehensive products, on-chain platforms compete for high-value users through transparency and self-custody, while mid-sized platforms must find differentiated entry points. No single moat can be permanently effective: low fees will be replicated, listing speeds will be chased, and product innovations will become industry standards, leaving only sustainable operations and risk management capabilities.

4.2 Product Expansion Must Follow Demand, but Cannot Use Hotspot Chasing to Mask Risks

This round of the bear market is not without new demand; rather, it concentrates on directions still attracting traffic: Meme represents attention-driven trading, AI picks up the technology narrative, and TradFi products introduce U.S. stocks, ETFs, and Pre-IPO expectations into a 24/7 market. If platforms only chase hotspots without clarifying the essence of products, they will accumulate new compliance and user risks.

For instance, stock tokens, stock perpetual contracts, and Pre-IPO contracts all utilize stock or company names, yet the rights obtained by users differ entirely. The former may provide tokenized economic exposure from the issuing party, perpetual contracts only track prices, while Pre-IPO products might include valuation and listing event expectations. The true capability of platforms in accordance with TradFi trends is not just rapid launches but clearly defining sources of pricing, trading times, underlying rights, clearing mechanisms, and risk boundaries.

AI and Meme products must also assess not just short-term transaction volumes but community sustainability, token concentration, true depth, and exit arrangements. Innovations during a bear market should enhance revenue and retention rather than delay exposure of operational issues with more high-volatility assets.

4.3 Observation of Hotcoin Samples: How Steady Operations and Product Responsiveness Construct Cyclical Resilience

Hotcoin was established in 2017 and has steadily operated for nine years by 2026, enduring multiple rounds of bull-bear transitions, liquidity contractions, and industry cleansings, and has never experienced a significant security incident since its inception. Currently, its service scope covers 183 countries and regions, with over 7.3 million registered users. In 2025, spot and contract trading volumes reached $710 billion and $9.32 trillion, respectively. Third-party data provides further observation window for its asset transparency: as of July 30, 2026, CoinMarketCap’s “Financial Reserves” page shows that the assets in Hotcoin’s public addresses amount to about $85.35 million, including approximately 768.34 BTC valued at about $49.19 million at the time, with the rest primarily in USDT, USDC, DAI, and ETH. Furthermore, Hotcoin ranks among the top ten in the cryptocurrency exchange transparency rankings by RootData.

On the product level, another long-term capability shown by Hotcoin is its ability to quickly respond to changes in market demand. In the face of the Meme coin and early on-chain asset booms, the platform launched the Alpha zone and continuously rolled out related trading activities; after the AI narrative gained momentum, it also promptly launched high-potential, high-heat projects; when funds started focusing on TradFi and on-chain securitization, the platform swiftly introduced tokenized securities at spot and perpetual contract markets. Its product boundary has gradually extended from traditional crypto assets to Meme, AI, and global stock price exposures, demonstrating not merely chasing hotspots but continuously adjusting product supply according to user interests and funding flows. For a medium-sized trading platform, real cyclical navigation capability lies in maintaining the basic stance through stable operation while promptly updating product offerings in response to market pulse changes.

Overall, the bear market has redefined the competitive standards for trading platforms: genuine barriers are no longer the quantity of listed assets or short-term transactions but the combined result of liquidity, safety trust, risk management, and product responsiveness. The nine years of operation provided by Hotcoin exemplifies that platforms must both maintain a basic stance with stable systems and secure mechanisms, while timely adjusting product supply based on market demand changes; only through conversion to real users, sustainable revenue, and long-term retention can they possess operational value. Ultimately, the platform that can navigate the cleansing cycle does not necessarily have to be the one chasing hotspots the fastest, but rather the operator that can gauge the market pulse without breaching risk boundaries—this will also determine whether capital is willing to re-price these survivors as the cycle turns.

5. Outlook and Conclusion: Old Supply Accelerates Exit, New Cycle Awaits Demand Takeover

After undergoing price declines, commercial clearings, and a reconstruction of platform competition, the question that the market truly needs to answer has shifted from “Who else will exit?” to “What signals can prove a new cycle has begun?” The bottom of the bear market is not determined by a single price, on-chain indicators, or the number of shutdowns, but is a gradual process driven by supply contraction, valuation reset, selling pressure exhaustion, and the takeover of new demand.

5.1 Outlook: The Market Will Shift from Indiscriminate Cleansing to Selective Repair

The current market is closer to the latter half of the bear market or bottoming phase, where the valuations and commercial bubbles accumulated during the last cycle have been significantly squeezed. However, stablecoin supplies have not yet resumed expansion, ETF fund inflows remain volatile, and upper-level trapped token pressures and macro liquidity stresses still exist. In the next period, the market is likely to complete low-level turnover amid repeated volatility, during which there may be significant rebounds, but also could test previous lows again.

The cyclical turning point requires confirmation from price, funding, and token structures together. BTC not only needs to突破关键成本区, but must also consistently stabilize and form higher lows; ETF and spot funds need to transition from intermittent inflows to continuous inflows, and stablecoin supplies must expand again; during the ascend, funding rates and open interest should remain restrained to avoid the market accumulating leverage anew at low levels. A more significant signal is when platform shutdowns, security incidents, or macro negatives continue to emerge, but prices do not set new lows—this indicates that sellers are exhausting, and new purchases begin to reclaim pricing power.

The next stage of repair will not manifest as synchronized increases in all assets, but rather through funds re-evaluating value. Liquidity will continue to concentrate on leading platforms and quality assets, while financing will place greater emphasis on real user bases, income capabilities, and distribution channels; directions such as stablecoins, payments, RWA, AI, and TradFi, which can connect to actual demand, may first gain capital backflow, while infrastructure and long-tail tokens lacking users will continue to exit. A true cyclical turning point is not simply the stopping of project closures, but rather the market beginning to reward survivors that can generate income and bear risks anew.

5.2 Conclusion: The Old Cycle Ends with Cleansing, The New Cycle Begins with Demand

AscendEX, BitMEX, and BitMart have successively exited, coupled with over a hundred projects listed for shutdown or ceasing operations, indicating that this round of the bear market has transmitted from asset price declines to exchanges' revenues, project financing, team sizes, and industry supply structures. History, size, and market position no longer inherently warrant a safety net; platforms and projects lacking sustainable cash flow, user retention, and risk management capabilities are being forced to leave the table.

However, the wave of shutdowns is not a directly usable bottom signal. Regulatory pressures, liquidity exhaustion, product failures, security incidents, and proactive migrations have different natures and will not complete the cleansing simultaneously. Current valuations have entered low levels, long-term chips remain stable, and institutional funds have shown phased inflows—these signals indicate that conditions for a bottom are accumulating, but are still insufficient to prove that the trend has reversed.

The real turning point will not be announced by the closing of the last exchange. It is more likely to occur at a stage where bad news continues to appear, but prices no longer decline: leverage remains restrained, spot funds continue to absorb chips, and capital does not buy into all narratives but is willing to reallocate to platforms with real users, income, and risk management capacities. The end of the old cycle is completed through cleansing, while the start of the new cycle must be proven by demand.

About Us

Hotcoin Research, as the core research institution of Hotcoin Exchange, is committed to transforming professional analysis into your practical weapon. Through “Weekly Insights” and “In-Depth Research Reports,” we analyze market trends for you; utilizing our exclusive column “Hotcoin Strict Selection” (AI+ expert dual screening), we lock in potential assets and reduce trial-and-error costs. Every week, our researchers will also face-to-face with you through live broadcasts, interpreting hotspots and predicting trends. We believe that warm companionship and professional guidance can help more investors navigate cycles and grasp the value opportunities of Web3.

Risk Warning

The cryptocurrency market is highly volatile, and investing itself carries risks. We strongly advise investors to undertake investments only after fully understanding these risks and under a strict risk management framework to ensure the safety of funds.

Website: https://www.hotcoin.com/zh_CN/learn/index/

X: x.com/Hotcoin_Academy

Mail: labs@hotcoin.com

Disclaimer: This article represents only the personal views of the author and does not represent the position and views of this platform. This article is for information sharing only and does not constitute any investment advice to anyone. Any disputes between users and authors are unrelated to this platform. If the articles or images on the webpage involve infringement, please provide relevant proof of rights and identity documents and send an email to support@aicoin.com. The relevant staff of this platform will conduct an investigation.