
Dear teammates, two significant events have occurred in the market over the past 12 hours that deserve close attention. First, Bitcoin has dropped below the 84,000 USDT mark, with nearly 400 million US dollars in liquidations in the past 12 hours due to long leverage being wiped out, leading to a concentrated release of selling pressure and a temporary easing of congestion in the futures market. Second, a certain whale bought 32,000 ETH at low prices through four new addresses, with an average price of 2,679 USDT, signaling a clear bullish sentiment. On one side, longs are being wiped out, while on the other side, a giant whale is bottom-fishing. This divergence indicates that the current market is in a critical phase of directional choice. Meanwhile, the probability of the Federal Reserve raising interest rates in October has soared to 69.7%, the US September composite PMI has jumped to 58.4, marking a five-year high, inflation pressures are heating up again, and expectations of tightening macro liquidity are suppressing risk asset valuations. The yield on Japan's 10-year government bonds has risen to 3.055%, reaching a new high since 1996, intensifying global upward pressure on interest rates and potentially further suppressing the crypto market as arbitrage funds return. On the other hand, Morgan Stanley's Bitcoin ETF has seen a record inflow of 1,100 BTC, while the Bitcoin ETF has net inflows of 715 million over four days, indicating that institutional funds are still continuing to flow in. With these mixed factors, Qinglan will use the TPV system to analyze it layer by layer.
Current price and time
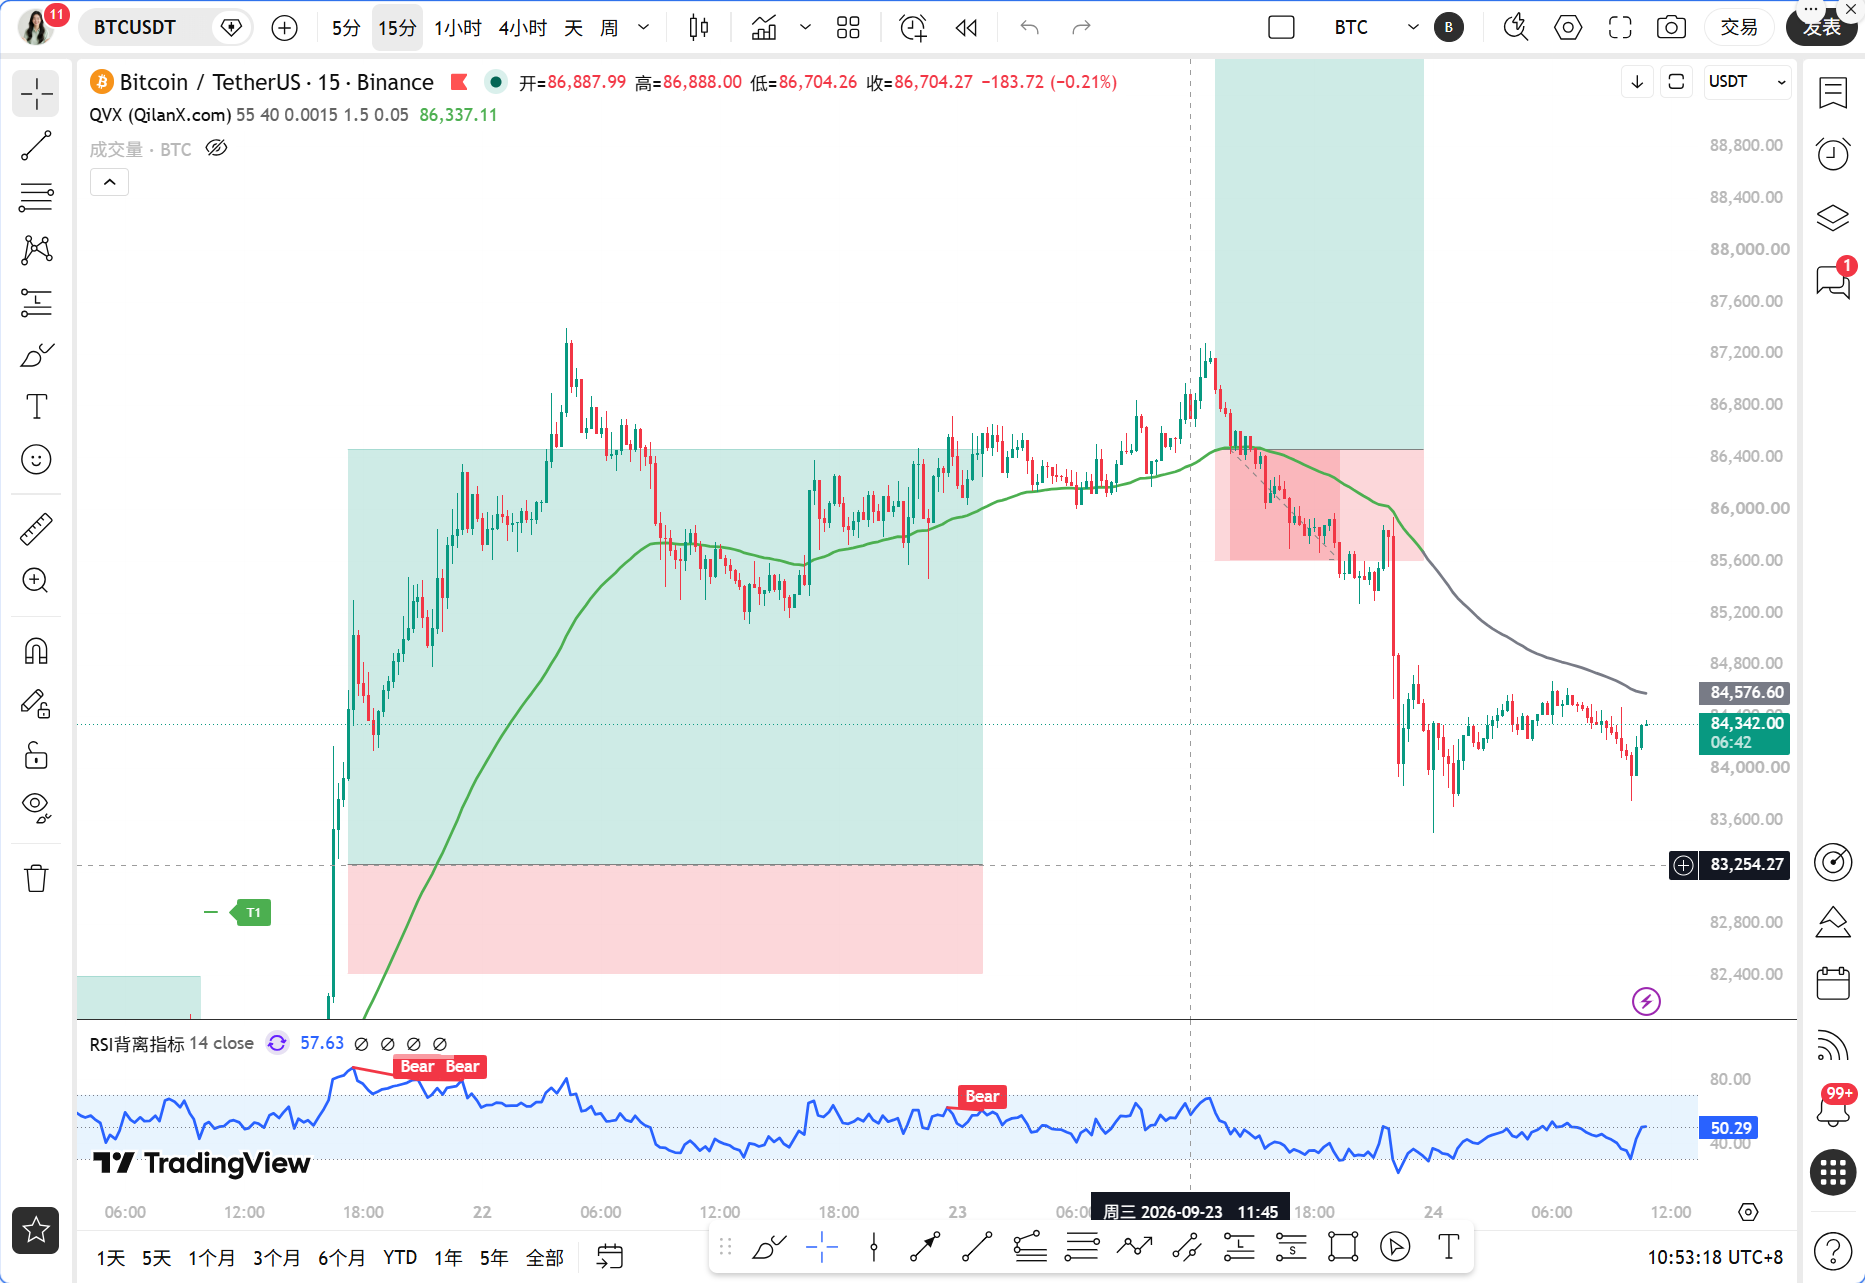
The current time is September 24, 10:53, with the latest BTC quote at 84,340 USDT. The 24-hour price fluctuation is -2.52%, and after breaking below 84,000, there has been a slight rebound, but the overall state remains under pressure.
Multi-cycle status overview
First, looking at the daily level. MA5=84,548.91, MA10=81,314.59, MA30=79,420.69, the moving average system remains in a bullish arrangement, with MA5 above MA10 above MA30, and the mid-term trend structure has not been broken. In terms of MACD, DIF=2,481.02, DEA=1,985.65, and the bar=495.37; both DIF and DEA are operating above the zero axis, indicating that bullish momentum still exists, but there are currently no new crossover signals. RSI=71.08 is in the overbought area, indicating that although the daily trend is upward, there is a short-term demand for overheating correction. Overall, the daily level is judged to be in the correction phase of a bullish trend.
Next, looking at the 4-hour level. MA5=84,580.39, MA10=85,454.51, MA30=83,661.34, with prices currently below MA5 and MA10 but still above MA30; short-term moving averages have started to turn downward with mid-term support at MA30 near 83,661. In terms of MACD, DIF=975.21, DEA=1,403.33, and the bar=-428.12; DIF has fallen below DEA to form a death cross, and the histogram continues to expand below the zero axis, with bearish momentum still being released. RSI=33.75 is close to the oversold area, but it has not yet entered extreme values. The 4-hour level is judged to favor short-term bears, but the approach to oversold may trigger a technical rebound.
Then, looking at the 1-hour level, which is the core reference period for the TPV system. MA5=84,344.67, MA10=84,355.03, MA30=85,386.88; moving averages are tangled short-term but show an overall downward pattern. In terms of MACD, DIF=-436.91, DEA=-411.62, and the bar=-25.29; both DIF and DEA are below the zero axis, with the histogram being negative, indicating that bearish momentum still exists but has begun to narrow. RSI=35.03 is in a weak area. The key point is EMA55=84,996.38; the current price of 84,340 is clearly below EMA55, with a gap of about 656 USDT, which is a range of 0.77%.
Finally, looking at the 15-minute level. MA5=84,177.50, MA10=84,221.96, MA30=84,361.37; moving averages are still arranged bearish but have started to converge. In terms of MACD, DIF=-70.87, DEA=-73.65, and the bar=2.78; a golden cross signal has emerged, and the histogram has flipped positive, showing signs of stabilization in the short term. RSI=42.70 has rebounded from a low point but is still below 50. The 15-minute level shows that the short-term bearish momentum is starting to exhaust, which may lead to a rebound correction.
TPV signal verification
According to the core rules of Qinglan's TPV system, we will verify the current signals one by one.
First, the EMA55 bullish-bearish boundary condition. The current price is 84,340 USDT, with the 1-hour EMA55 at 84,996.38; the price is clearly below EMA55. Out of the past eight 1-hour candlesticks, the number of closing prices above EMA55 is 0/8, and there have been 0 crosses. This means that for eight consecutive 1-hour candlesticks, the closing prices have all been below EMA55, making the bearish trend area determination very clear. Meanwhile, the absolute distance from the current price to EMA55 is 0.77%, which is far above the 0.3% fluctuation threshold, and the number of times closing prices have been above EMA55 is not between 3 to 5, nor does it meet the condition of having at least 2 crosses. Therefore, the current situation does not meet the determination standard for a sideways trend, and the system determines it to be a unidirectional bearish trend.
Second, the short-selling condition verification. Condition one, price under pressure below the 1-hour EMA55 with two consecutive 1-hour closing prices below EMA55; this condition is fully met, in fact, the consecutive count is eight candlesticks all below EMA55, indicating a very strong pressured state. Condition two, pressure encountered resistance shape. From the recent candlestick structure, prices have encountered resistance and retreated multiple times after rebounding to the 84,500 to 84,800 area, with the 4-hour MA5=84,580 constituting short-term pressure, while the 1-hour MA30=85,386 is a stronger resistance level above. Prices have failed to break through effectively at these positions, conforming to the characteristics of resistance encountered. Condition three, weak rebound. The 1-hour MACD bar is -25.29; while the histogram has narrowed somewhat, both DIF and DEA are operating below the zero axis, overall remaining in a state dominated by bearish momentum. RSI=35.03 has slightly rebounded from a low but is far from returning above 50, indicating weak rebound strength. However, it is important to note that the 15-minute MACD has already shown a golden cross signal with the histogram flipping positive to 2.78, indicating that short-term bearish momentum is indeed exhausting, which may trigger a brief rebound. Overall, conditions one and two of short-selling have a high level of satisfaction, while condition three has some flaws since a signal for momentum exhaustion has emerged at the 15-minute level.
Third, the long-buying condition verification. Condition one, the price stabilizes above the 1-hour EMA55 with two consecutive 1-hour closing prices above EMA55; this condition is completely unsatisfied, with the current price operating below EMA55. Condition two, support stabilization shape; the current price shows preliminary signs of stabilization near 84,000, with a golden cross in the 15-minute level, but has not yet formed a clear long lower shadow or bottom type structure. Condition three, downtrend momentum exhaustion; the 15-minute MACD golden cross is a positive signal, but the 1-hour MACD bar, while narrowing, remains negative, and RSI=35.03 has not yet risen from below 30. Therefore, the long-buy conditions are currently unmet, and more confirmation signals are needed.
On-chain and funding situation
The Fear and Greed Index reports 71, which is in the greedy zone. Although BTC has pulled back by 2.52% from highs, market sentiment has not turned to panic, which is both a double-edged sword. On one hand, it shows that market confidence remains, while on the other hand, it also means that the pullback may not have fully released risks, and the possibility of further downside exploration cannot be ruled out while greedy sentiment has not dissipated.
The funding situation shows a clear divergence between bullish and bearish. On the bearish side, the probability of the Federal Reserve raising interest rates in October has skyrocketed to 69.7%, while the US September PMI hitting a five-year high has reinforced tightening expectations. The US 10-year treasury yield has surpassed 5.08%, reaching an 18-year high; the yield on Japan's 10-year bonds has reached a new high since 1996, and the rising global risk-free rates are attracting funds out of the crypto market. On the bullish side, Morgan Stanley's Bitcoin ETF has seen a record inflow of 1,100 BTC, with net inflows of 715 million over four days; the NYSE is exploring tokenization of US stocks, the SEC is withdrawing its crypto case, and advancing tokenized securities innovation exemption pilots, both institutional funds and friendly regulatory signals provide underlying support for the market. The behavior of the giant whale buying 32,000 ETH at low prices is also noteworthy, but it's important to highlight that another ETH whale urgently reduced its position by 42,000, realizing a profit of 21.12 million US dollars, indicating that there are also divergences within the whale group.
Key attack and defense levels
The first resistance level above is near the 1-hour EMA55 at 84,996; this is the bullish-bearish boundary line of the TPV system. The price needs to retake this level and close above it for two consecutive 1-hour candlesticks to reverse the current bearish determination. The second resistance is near the 4-hour MA5=84,580; the third resistance is near the 1-hour MA30=85,386.
The first support level below is near 83,661, which is where the 4-hour MA30 is located; this is also the area the price has tested repeatedly recently. The second support level is at the round number of 83,000; if broken, it may further drop toward the 82,000 area. The daily MA10=81,314 is a stronger support reference at lower levels.
Trading ideas
Direction: The current TPV system determines the market to be in a bearish trend area, with the main direction leaning bearish. However, a golden cross has appeared at the 15-minute level, and the histogram of the 1-hour MACD has narrowed, indicating a potential for a rebound in the short term. Therefore, short-selling should wait for the rebound to encounter resistance before entering, and it is not recommended to directly chase shorts at the current position.
Entry conditions: If the price rebounds to the 84,500 to 85,000 area, which is near the 4-hour MA5 and 1-hour EMA55, appearing with long upper shadows or topping patterns indicating pressure resistance, while the 1-hour MACD histogram fails to turn positive or RSI falls near 50, then a short position can be considered. If the price directly breaks below 83,600 and closes below it for two consecutive 1-hour candlesticks, a short position can also be taken.
Stop loss: The stop loss for the short position should be set about 200 to 300 USDT above the EMA55, which is in the range of 85,200 to 85,300. If the price retakes EMA55 and closes above for two consecutive 1-hour candlesticks, the bearish logic is invalidated and one must exit.
Target: The first target is around 83,600, the second target is the round number of 83,000, and the third target is the 82,000 area. After reaching the first target, half of the position can be reduced, and the remaining position should move the stop loss to protect profits.
Risk warning
The greed index is still high at 71, and the interest rate hike probability is approaching 70%; market sentiment and macro pressures may cause dramatic fluctuations. It is essential to strictly control positions and leverage.
Follow Qinglan's crypto classroom to seize more trading opportunities together! Welcome to visit the official website www.qinglan.org
📊 Qinglan TPV trading strategy backtesting reference
🕒 Last backtesting time 09-24 07:00:02
Total analysis: 4,138 Backtests: 4,138 Accuracy: 78.6% (3,251/4,138)
Disclaimer: This article represents only the personal views of the author and does not represent the position and views of this platform. This article is for information sharing only and does not constitute any investment advice to anyone. Any disputes between users and authors are unrelated to this platform. If the articles or images on the webpage involve infringement, please provide relevant proof of rights and identity documents and send an email to support@aicoin.com. The relevant staff of this platform will conduct an investigation.