After the engulfing pattern on October 7, the market has been adjusting in the past few days. Yesterday, the price dropped below 120,000. As we mentioned yesterday, from a Fibonacci perspective, it would be best for the price to retrace to around 120,000, and if it goes deeper, to around 117,000. As we anticipated, a retracement occurred yesterday, and the price has slightly increased since then, but the momentum is not strong. The recent price movements are a manifestation of the power of the engulfing pattern.
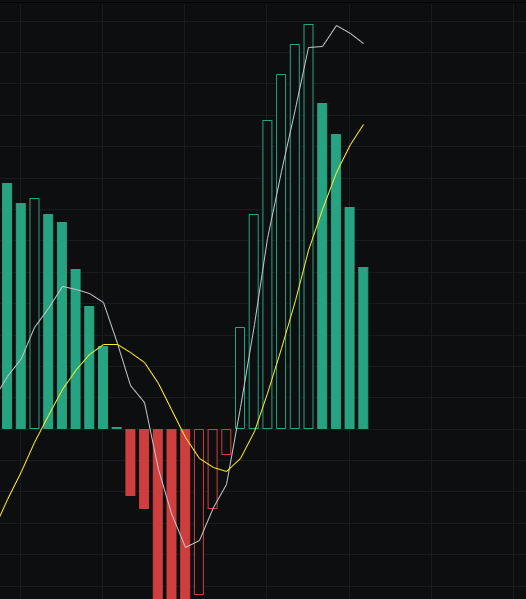
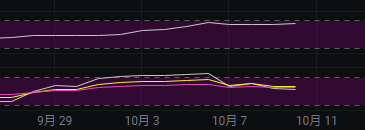
From the MACD perspective, the volume is currently retracting, and the fast line has started to turn downwards. We will need to pay attention to whether the fast line can intersect with the slow line.
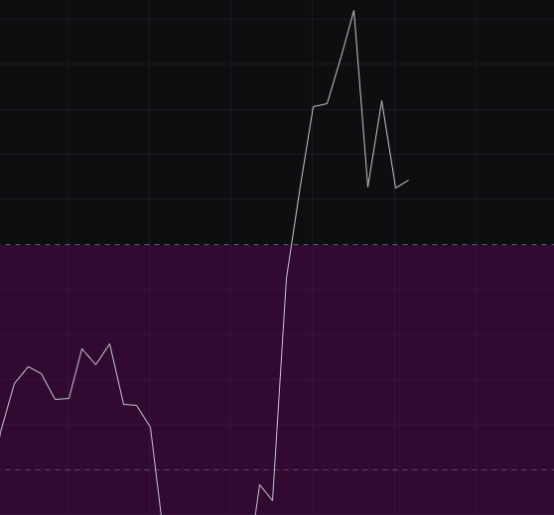
From the CCI perspective, the CCI is still above 100, maintaining a bullish pattern, so it is still too early to be bearish.
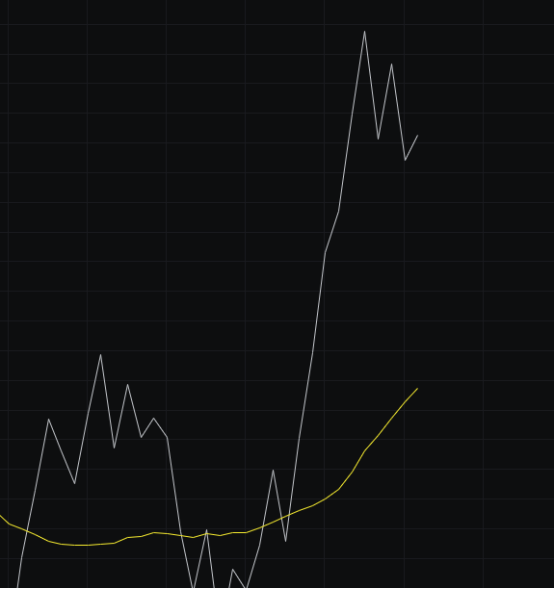
From the OBV perspective, with the decline over the past two days, the OBV has retreated, but the slow line is still upward, and the overall pattern has not been broken.
From the KDJ perspective, after the death cross occurred a couple of days ago, there has been a certain degree of decline today. If the bulls cannot push the price up in the next few days, the KDJ will continue to move downwards.
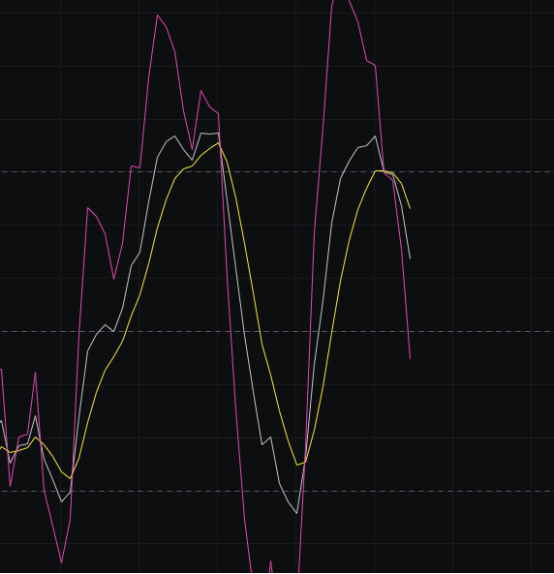
From the MFI and RSI perspective, the MFI is in a neutral range, but the RSI trend is not good, continuously pressing down to form a death cross and entering the neutral range. If it cannot rise, the RSI will continue to decline, which would be unfavorable for the bulls.
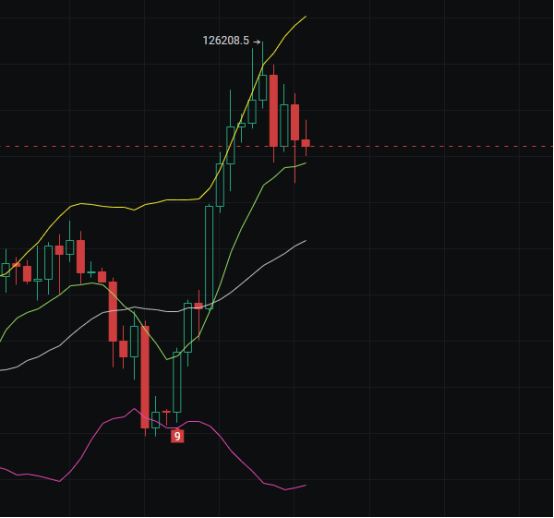
From the moving averages perspective, we mentioned yesterday that it would be best to test around 120,000, and if deeper, around 117,000. Today, we see that it did test around 120,000 yesterday, but the trend today is still very weak. The price may test the BBI again, and we need to see if the BBI can hold. If it cannot hold, there is a possibility of further decline.
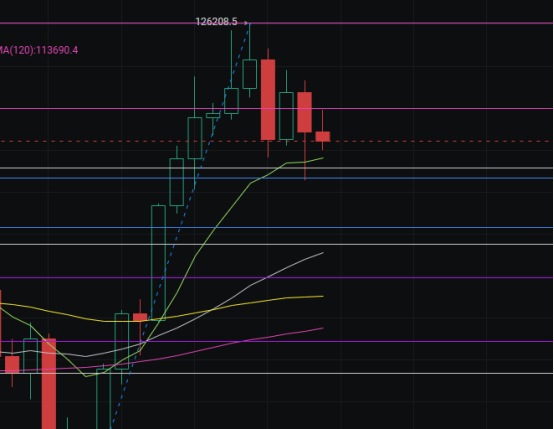
From the Bollinger Bands perspective, the upper band is still pushing upwards, and the lower band has started to rise. Here, we mainly need to observe whether it will trend upwards or move in a wide range, so we need to monitor the next few days.
In summary: Following the engulfing pattern on October 7, the current market is still affected, and the price may test the BBI again. Therefore, long positions should have stop-losses in place. Additionally, Sunday is approaching, and based on past trends, the market is not expected to perform well, so do not hold too much hope for Sunday. Thus, I believe the market trend this week is very weak, but since it is not over yet, we cannot draw a conclusion. For this week, it would be best to close with a bullish candle. The first target for the bulls today is to not break below 120,000, the second target is to rise above 120,500, and the third target is to rise above 121,600. We will judge the strength of the bulls based on the final price. Support is seen at 120,000-117,000, and resistance is at 121,600-122,500.
Disclaimer: This article represents only the personal views of the author and does not represent the position and views of this platform. This article is for information sharing only and does not constitute any investment advice to anyone. Any disputes between users and authors are unrelated to this platform. If the articles or images on the webpage involve infringement, please provide relevant proof of rights and identity documents and send an email to support@aicoin.com. The relevant staff of this platform will conduct an investigation.