Today we mainly discuss two issues:
First, is there a possibility for the short-term market to continue rising?
Second, where is the most suitable position to lay out short positions?
- Continuation of yesterday's viewpoint: Short-term adjustment is "close to ending," but not a peak reversal
Yesterday we mentioned "about to end," not "already peaked."
The reason is simple: there has not been a clear top signal on the 1-hour chart.
Therefore, we provided several expectations, generally believing that:
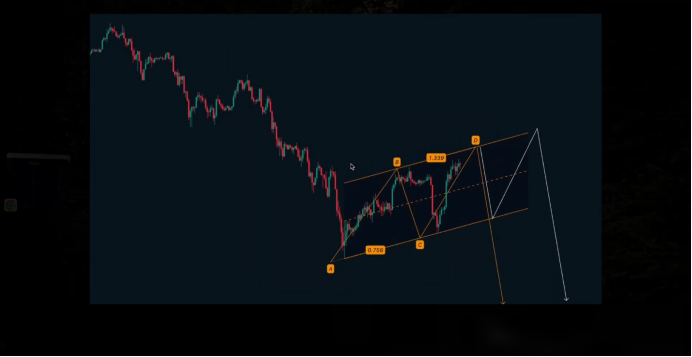
Currently, it is highly likely a wide-ranging upward channel.
The overall structure leans towards "descending continuation" or "structural adjustment."
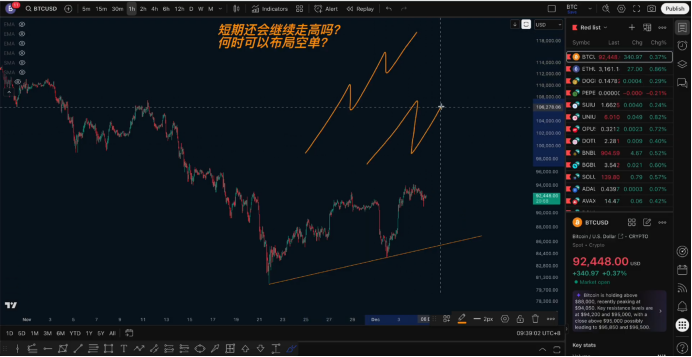
This segment of the rise has the opportunity to form an "equidistant segment" upward.
If it is a standard equidistant segment rise, the development area before point D is between 96,800 – 97,000.
In other words, this segment of the market is likely to challenge around 97,000 – 98,000, and then enter a new round of decline.
- Two possible ways of decline
Expectation 1: The price hits 97,000 – 98,000 and encounters resistance, directly breaking through the lower edge of the channel, starting a new round of daily-level decline.
This means the daily-level rebound has ended.
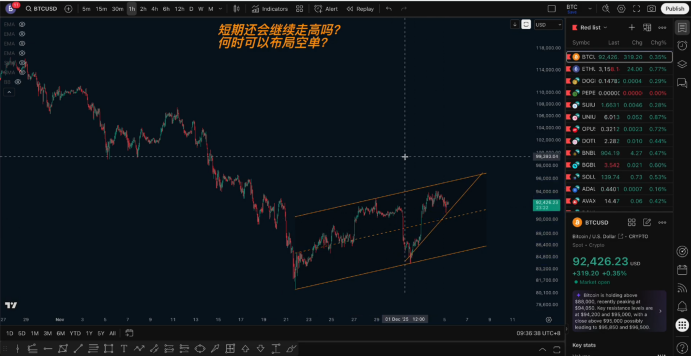
Expectation 2: The price continuously makes new highs within the channel but maintains an overall upward fluctuation, completing a round of "inducing long liquidation," and then starts to decline.
That is, "slowly grinding, continuously pushing higher, but ultimately will come down."
- Current price is close to the top area, but there is still a possibility of further challenges
Yesterday we also reminded: breaking through the previous high, it is not recommended to chase high.
The actual market indeed followed expectations, first retreating from about 93,500 to around 91,000, resulting in several thousand points of fluctuation.
However, the overall structure has not changed:
There is still an opportunity to challenge the 96,800 – 97,000 range in the short term.
Reasons:
The upward segment has not fully tested the upper boundary of the channel;
The structure conforms to "equidistant segment upward";
The previous upward segment also exhibited a similar structure (equidistant segment + upper channel boundary test);
Overall, it still belongs to a fluctuating upward structure, rather than a one-sided decline.
- How to lay out short positions? — Two plans (both require light positions)
Since the position is close to the expected top, today we focus on: how to lay out short positions more safely?
Plan 1: Lightly short in the current area
Basis:
A turning point breakout appears on the 1-hour level.
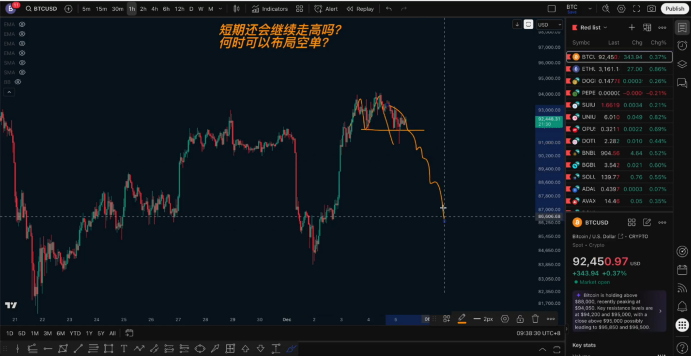
This structure means: the market may directly turn down from the current position.
Defense: Set at the previous high point of 94,000.
Nature: Left-side probing, must be light positions.
Plan 2: Wait for the price to challenge the 96,800 – 97,000 range before shorting (more conservative)
This is the main viewpoint we provided yesterday and is the most straightforward approach structurally:
Wait for the price to touch the upper edge of the channel.
Complete the equidistant segment rise.
Lay out short positions after encountering resistance.
Nature: Left-side betting on resistance, but closer to the key position.
- Why do we say the rebound is about to end?
From a structural perspective, it currently belongs to "consolidation upward," not a strong trend upward.
The difference between the two upward methods:
Method 1: Strong trend upward (obvious bullish advantage)
The downward force is small.
The upward movement is strong and continuously accelerating.
Usually occurs in a strong bullish cycle.
Method 2: Fluctuating upward (balanced forces between bulls and bears)
The price can rise, and it can also fall deeply.
The upward and pullback amplitudes are comparable.
Commonly seen in rebounds within a bearish environment.
Currently, it clearly belongs to Method 2: fluctuating upward.
This means:
The upward movement is difficult to sustain.
After each rebound ends, the pullback space is usually quite deep.
The pullback may approach the previous low point or the rising trend line.
Therefore, whether it peaks from 96,800 – 97,000 or turns down from the current turning point, there is a chance to experience a deeper pullback.
- How to view the pullback targets?
In the short term:
First target: Pull back to the rising trend line (around 90,000).
Further target: Approach the previous low point area.
After pulling back to this point:
It may start a new round of decline (forming a continuation breakdown).
Or it may again fluctuate upward, repeating the long induction.
Follow me, join the community, and let's improve together. The article release has a delay and is for reference only.

Disclaimer: This article represents only the personal views of the author and does not represent the position and views of this platform. This article is for information sharing only and does not constitute any investment advice to anyone. Any disputes between users and authors are unrelated to this platform. If the articles or images on the webpage involve infringement, please provide relevant proof of rights and identity documents and send an email to support@aicoin.com. The relevant staff of this platform will conduct an investigation.