Written by: White55, Mars Finance
In the current context of phased adjustments and differentiation in the cryptocurrency market, the performance differences between Ethereum (ETH) and Bitcoin (BTC), the two core cryptocurrencies, have become increasingly prominent, making them the focal point of market attention.
Recently, ETH has not only shown far greater attractiveness than BTC in terms of spot ETF capital flows, but it has also consistently outperformed in short-term returns. Moreover, multiple market signals indicate that traders are actively adjusting their positions in anticipation of a potential 20% rally for ETH.
From the recent capital trends, this week ETH has outperformed BTC across two key dimensions: price movement and ETF capital flows. This phenomenon further confirms that the view of capital rotation in the market is gradually becoming a reality.
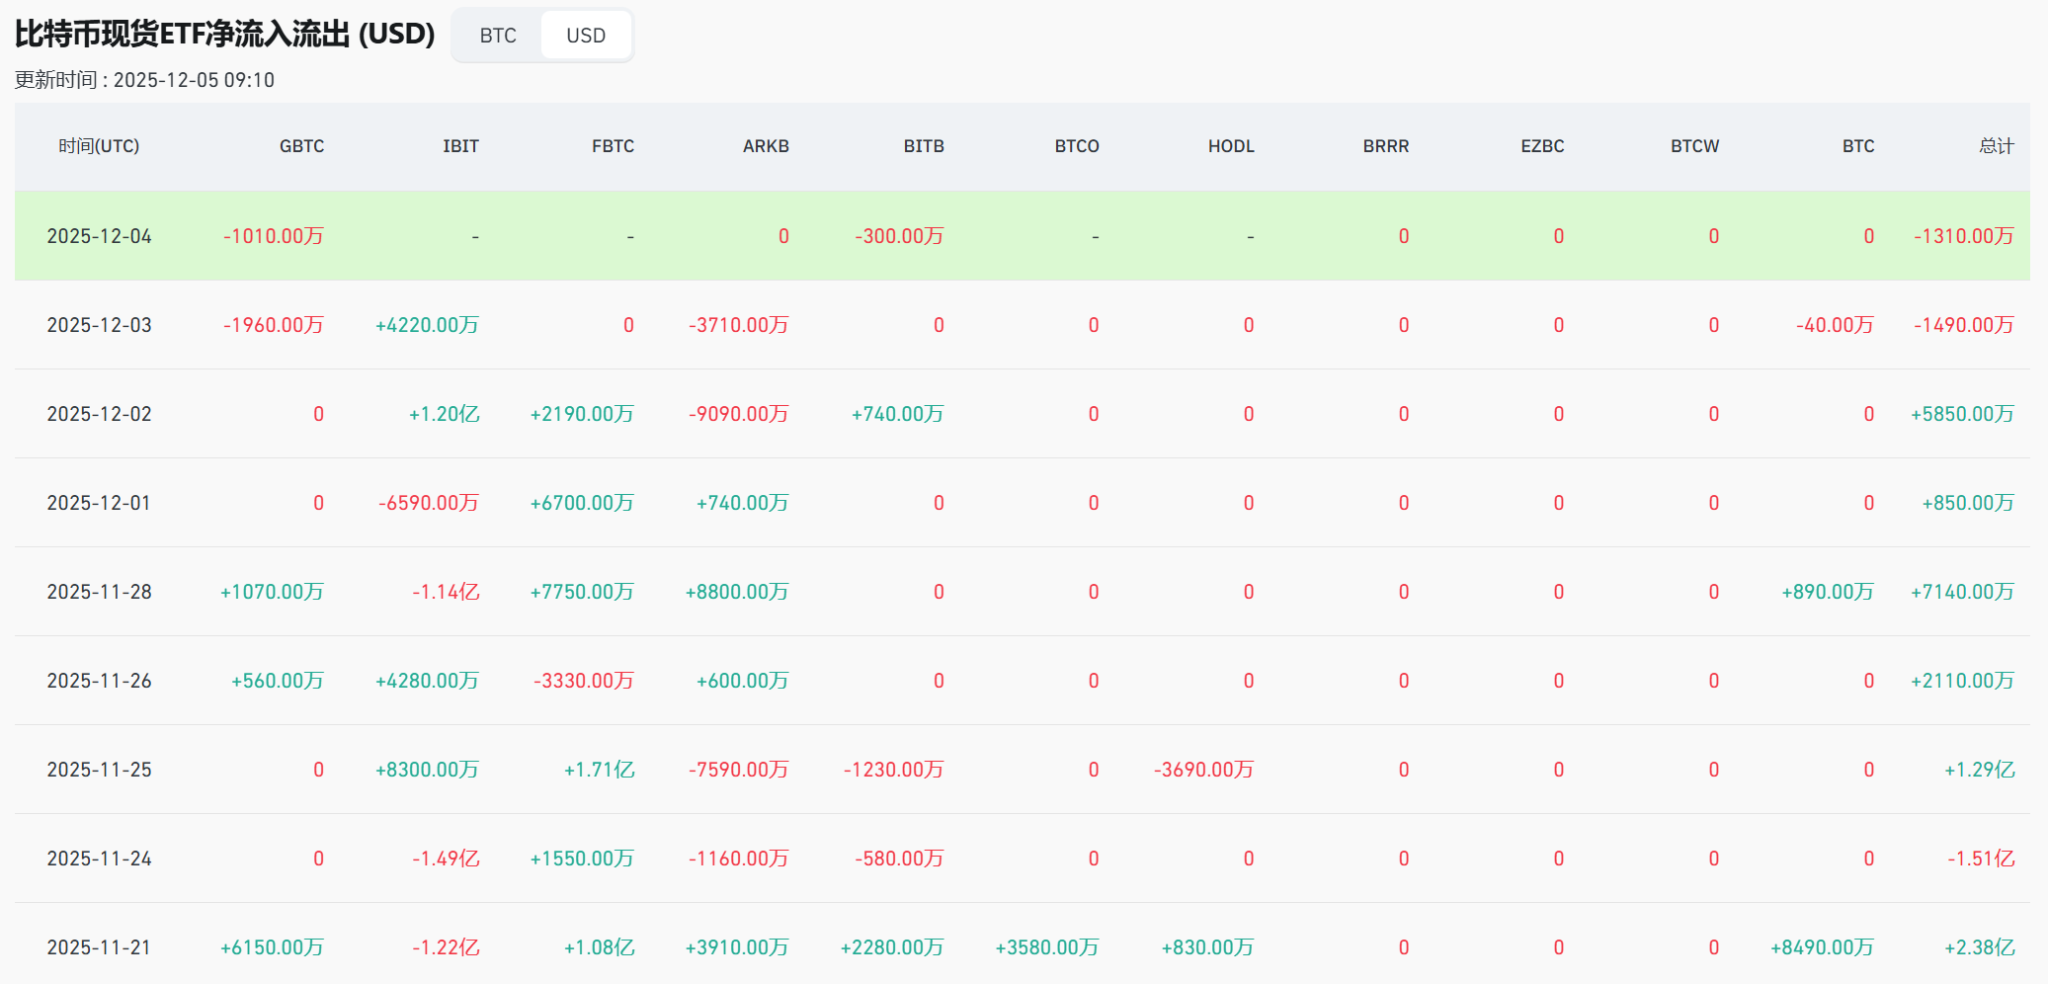
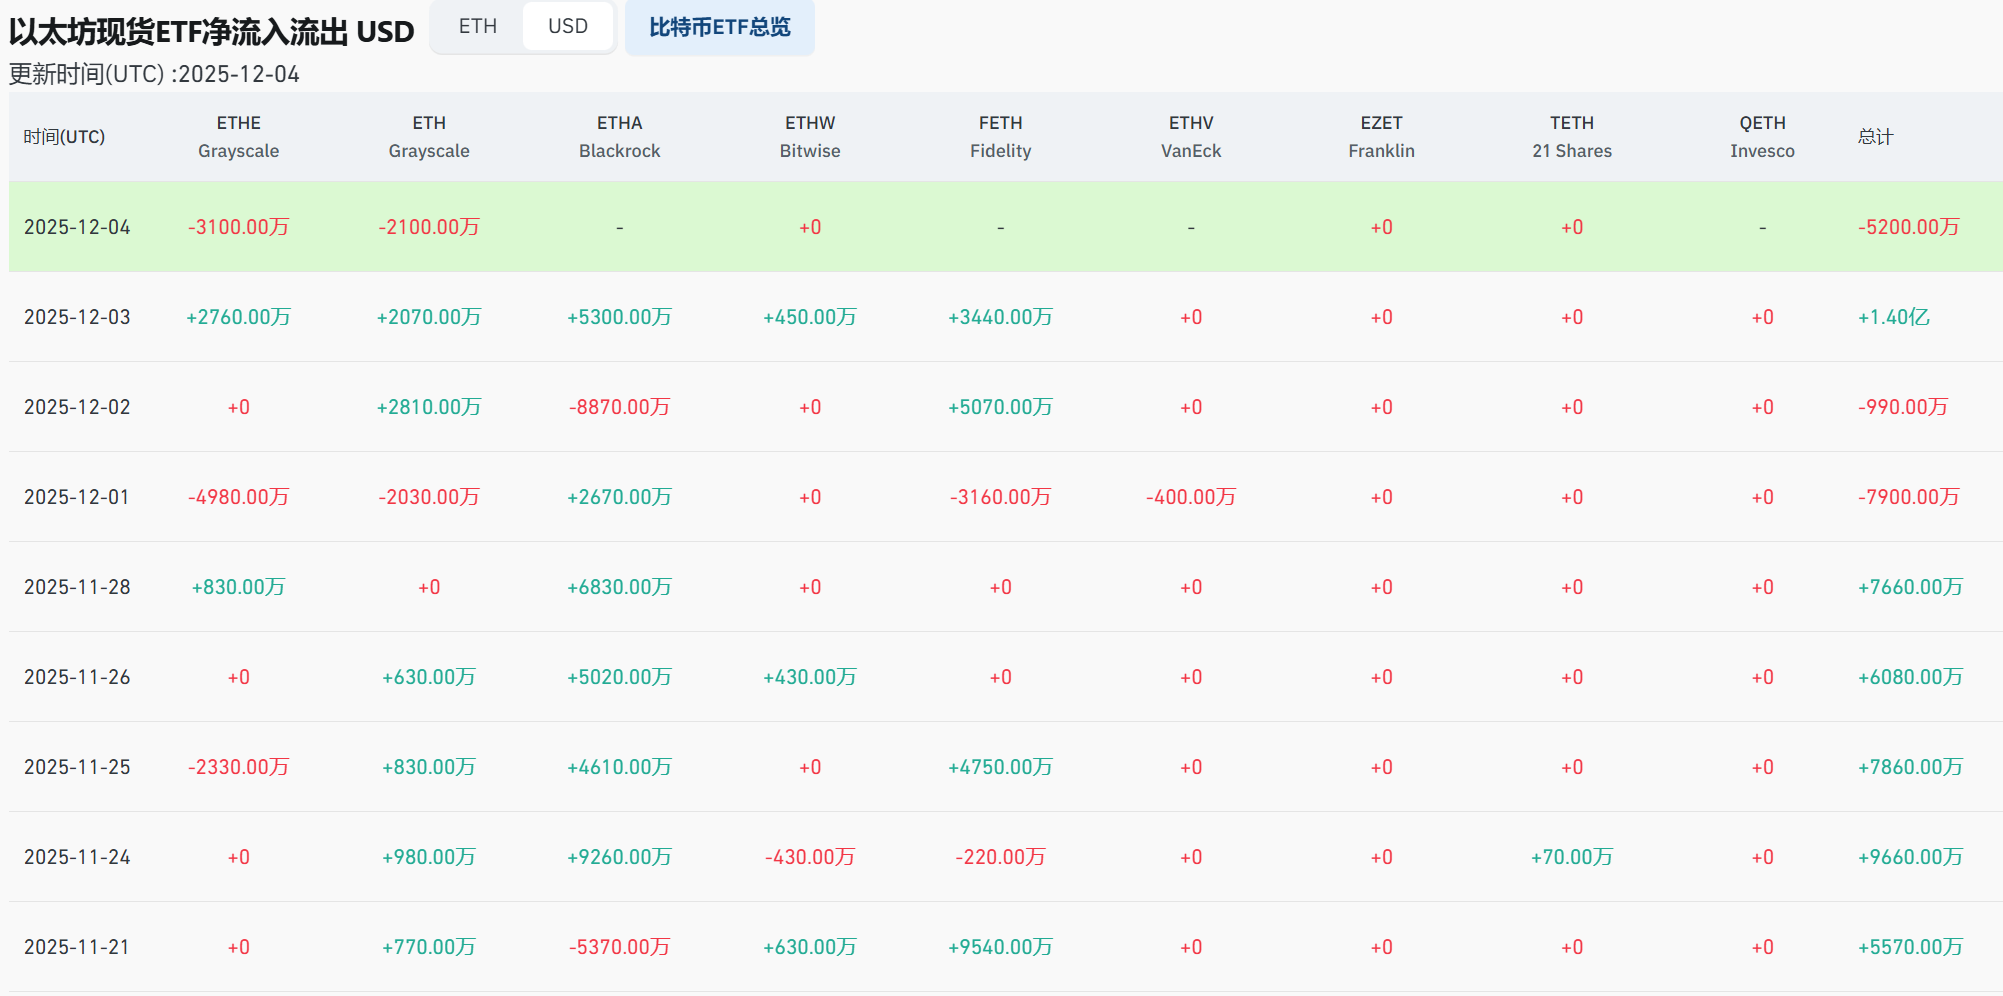
As an important barometer of capital flow in the cryptocurrency market, the capital flow of ETFs often reflects investors' asset allocation preferences. The data from the past two weeks clearly shows a shift in current market preferences: the inflow of capital into Ethereum spot ETFs has accelerated significantly, with a net inflow of $360 million, in stark contrast to the $120 million net inflow for Bitcoin spot ETFs during the same period. The inflow into ETH spot ETFs is three times that of BTC.
This capital rotation is not coincidental; it stems from investors' recognition of ETH's recent technical breakthroughs, ecological application expansions, and structural market opportunities, providing important capital support for ETH's subsequent rise and further enhancing its relative upward momentum, leading to higher market expectations for ETH's future performance.
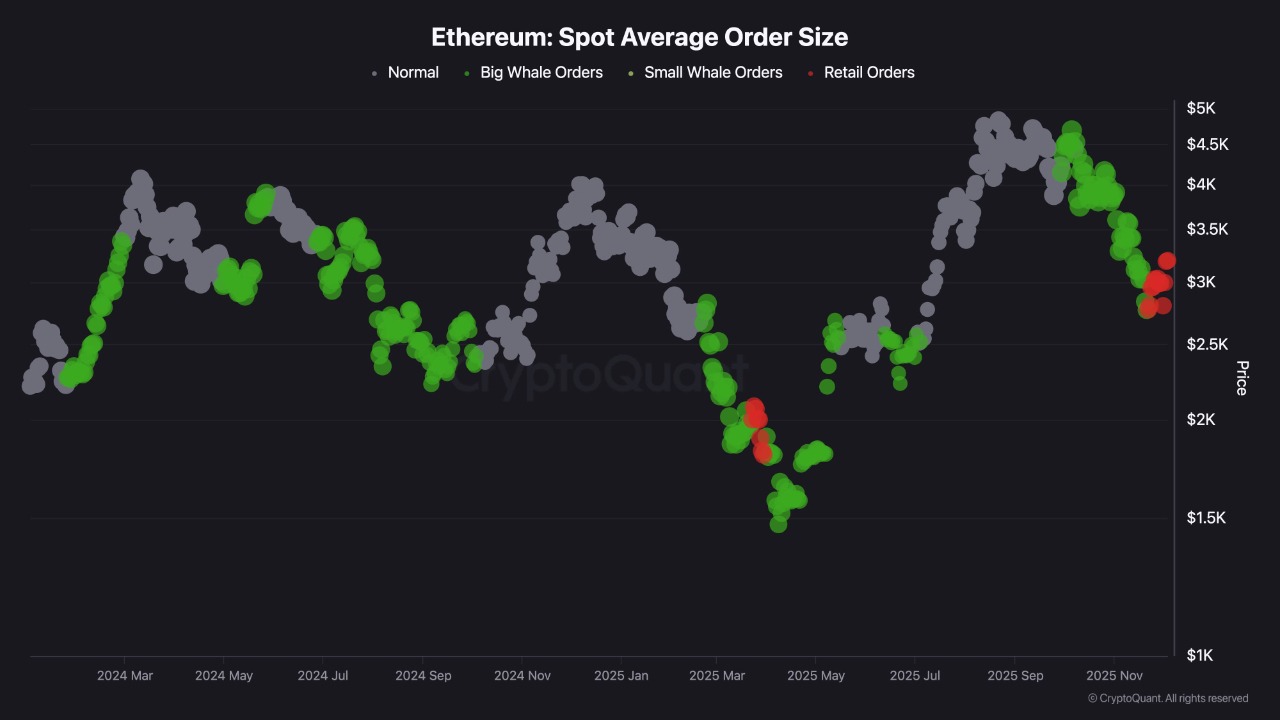 Average order size of Ethereum spot from retail investors. Data source: CryptoQuant
In addition to the continuous inflow of institutional capital through ETF channels, the trading behavior of retail investors has also become a key factor influencing ETH's recent performance, closely related to the potential adjustment rhythm of the market. According to data from CryptoQuant, the average order size indicator for Ethereum spot has recently shown a significant shift in trading behavior, particularly pronounced after ETH's price fell below $2700 on November 21.
At that time, ETH's price quickly dipped below $2700, causing a brief panic in the market due to the short-term decline, with some investors worried about further price corrections. However, at this critical juncture, retail investors displayed a markedly different trading attitude, with a large number of retail buyers actively entering the market to absorb ETH, continuously buying through small, high-frequency orders, which directly drove a strong rebound in demand, allowing ETH's price to quickly recover and re-establish a key support level.
Looking back at ETH's previous market performance, this scenario of active retail entry is not the first occurrence, especially during the accumulation phase from March to May this year, where similar retail trading activity was observed. Historically, after early retail activity drives a rebound, the market often experiences a deeper correction. This is mainly because retail capital tends to be highly short-term and speculative; once a rebound reaches a certain magnitude, some retail investors may choose to sell due to profit-taking or concerns about a correction, leading to a temporary decline in market liquidity and gradually eliminating latecomers who chase higher prices, completing the market's position adjustment.
From the current market dynamics, this historical pattern may still play a role, suggesting that ETH may still experience a controllable correction within the current rebound trend. This correction is not necessarily a bad thing; it can help the market digest short-term profit-taking, adjust position structures, and lay a solid foundation for a more sustained and stronger upward trend, avoiding market volatility risks caused by rapid short-term gains.
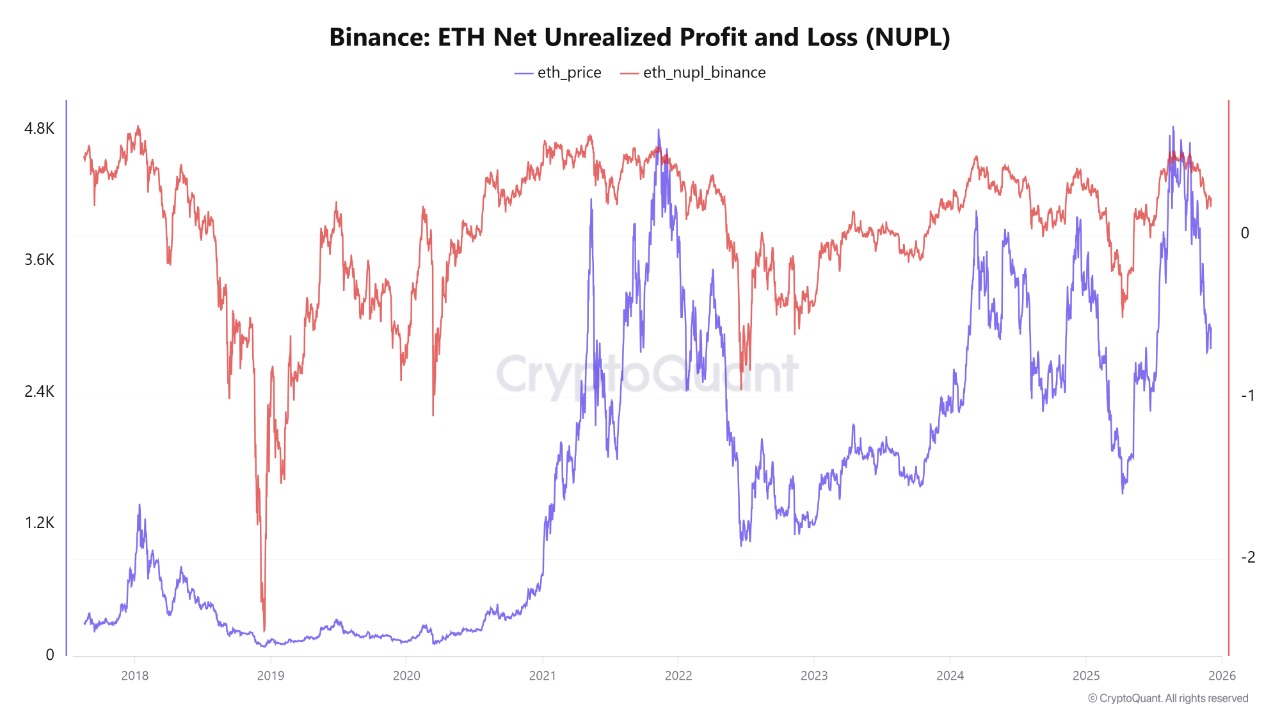 ETH NUPL data on Binance. Source: CryptoQuant
When analyzing ETH's market sentiment and holder status, the net unrealized profit and loss (NUPL) is a core indicator that provides important reference. It intuitively reflects the overall profit status and emotional tendencies of investors in the current market.
Currently, Ethereum's NUPL value is close to 0.22, which is relatively reasonable within the historical data of the cryptocurrency market, indicating that the current ETH market is in a relatively balanced state—neither exhibiting a frenzied atmosphere due to excessive speculation nor falling into a depressed state caused by deep losses. Investors are generally maintaining a moderate profit status. This moderate profit status is crucial for the healthy development of the market, as it can sustain investors' confidence in ETH without triggering large-scale chasing behavior, thus avoiding market bubbles.
For ETH's subsequent performance, maintaining the NUPL above 0.20 is a positive signal. As long as this level can be sustained, once the market encounters favorable catalysts—whether it be technical breakthroughs in the ETH ecosystem, further inflows of institutional capital, or improvements in the overall cryptocurrency market environment (such as clearer regulatory policies)—market sentiment can respond quickly, continuing to support ETH's rebound and providing ample momentum for price breakthroughs to higher levels.
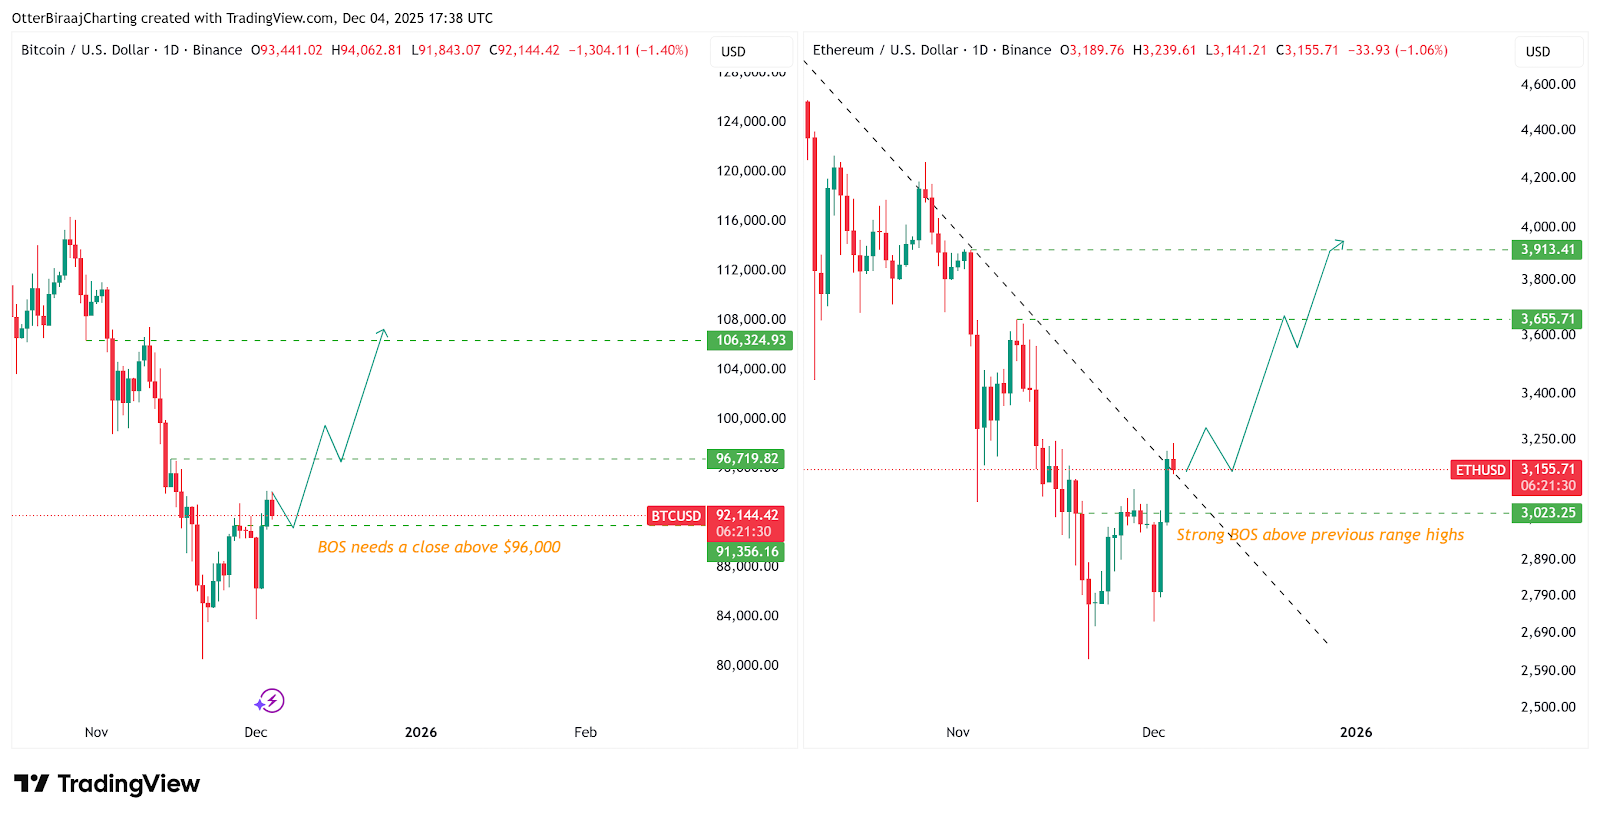 Comparison of daily charts for BTC and ETH. Data source: TradingView
From a technical analysis perspective, Ethereum's price pattern on higher time frames (HTF) is clearer and has a distinct advantage compared to Bitcoin, and this technical advantage has become an important support for ETH's recent outperformance against BTC.
Recently, ETH successfully broke through previous structural resistance levels (BOS) and set a new 20-day high in the process, smoothly surpassing the $3200 mark. This breakthrough is not coincidental; it has been accompanied by a continuous increase in buying power, especially when breaking through the key resistance level of $3200, where market trading volume significantly increased. This not only validates the effectiveness of the breakout from a volume perspective but also indicates that buyers in the market have successfully overcome previous resistance, officially initiating a trend reversal process.
In contrast, Bitcoin's technical pattern is relatively lagging. As of now, BTC still needs to achieve a decisive daily closing price above $95,000 to confirm its own structural breakout. Until then, BTC's performance remains somewhat uncertain, having repeatedly retreated due to increased selling pressure when approaching the $95,000 mark.
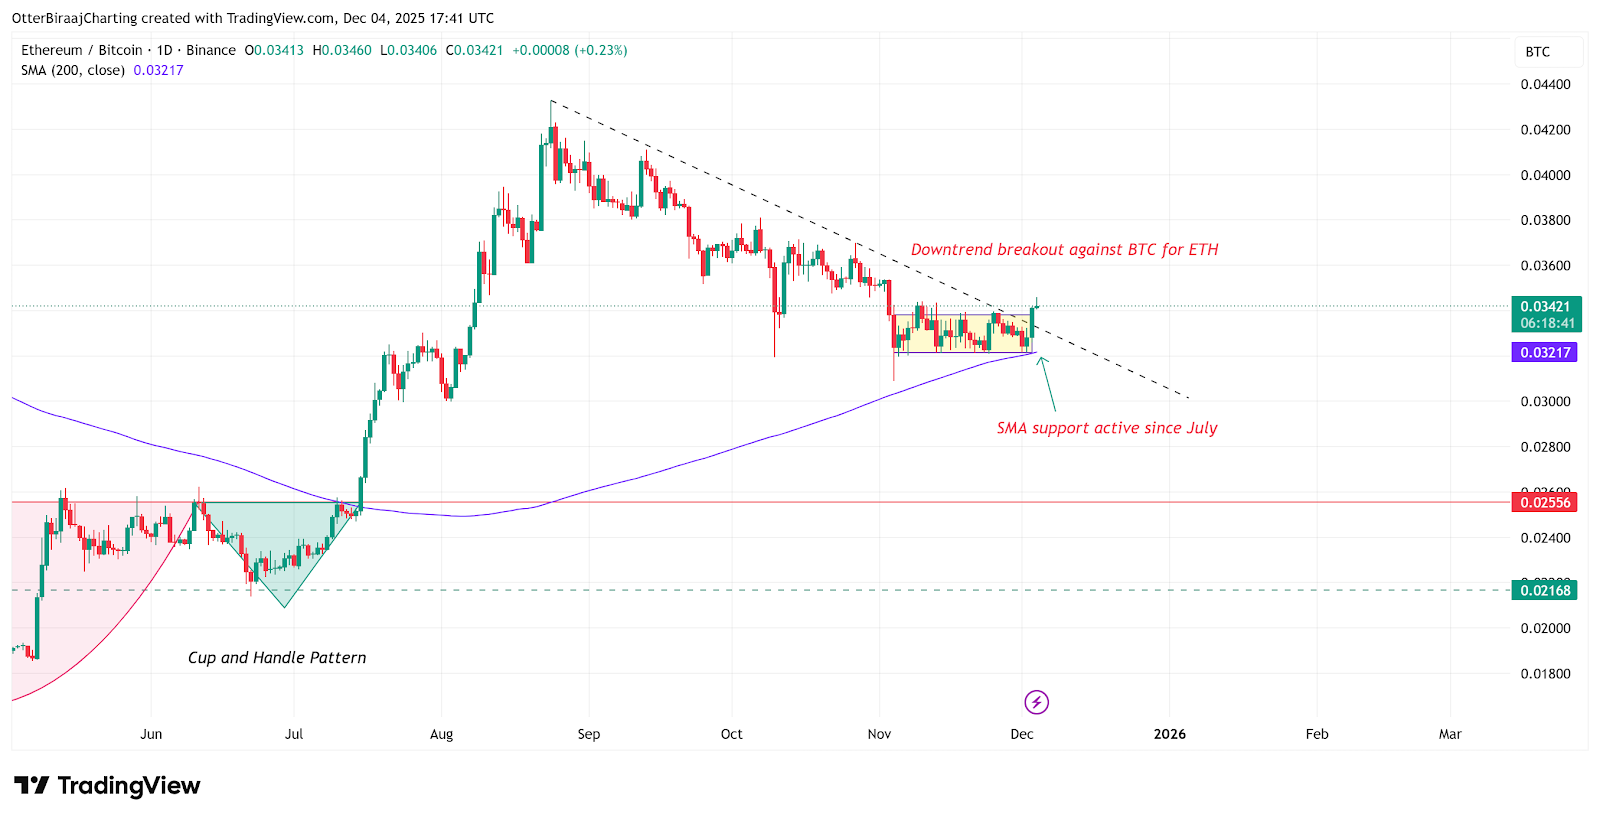 Analysis of the daily chart for ETH/BTC. Data source: TradingView
The daily chart of ETH/BTC further reinforces ETH's relative advantage, confirming ETH's strong pattern from the perspective of the inter-cryptocurrency price relationship. This currency pair has successfully broken through a consolidation range that lasted for 30 days. Prior to this, the supply within this consolidation range had repeatedly limited the rise of ETH/BTC, with selling pressure emerging whenever the price approached the upper boundary of the range, resulting in a pattern of multiple tests followed by retreats.
The realization of this breakthrough is largely attributed to the successful retest of the 200-day simple moving average (SMA) for ETH/BTC. Since July of this year, the 200-day SMA has provided stable support for this currency pair, becoming an important technical support level. Whenever the price falls back to this moving average, it attracts a large influx of buying, pushing the price back up. Historical data clearly shows that whenever the ETH/BTC currency pair re-establishes itself above the 200-day SMA and successfully breaks through a prolonged consolidation range, it often leads to a period where ETH consistently outperforms BTC, during which ETH's gains typically exceed those of BTC, and the trend of capital flowing towards ETH becomes more pronounced.
The current movement of the ETH/BTC currency pair perfectly aligns with this historical pattern, undoubtedly providing strong technical support for ETH's continued outperformance against BTC and enhancing market optimism regarding ETH's upward potential.
Disclaimer: This article represents only the personal views of the author and does not represent the position and views of this platform. This article is for information sharing only and does not constitute any investment advice to anyone. Any disputes between users and authors are unrelated to this platform. If the articles or images on the webpage involve infringement, please provide relevant proof of rights and identity documents and send an email to support@aicoin.com. The relevant staff of this platform will conduct an investigation.