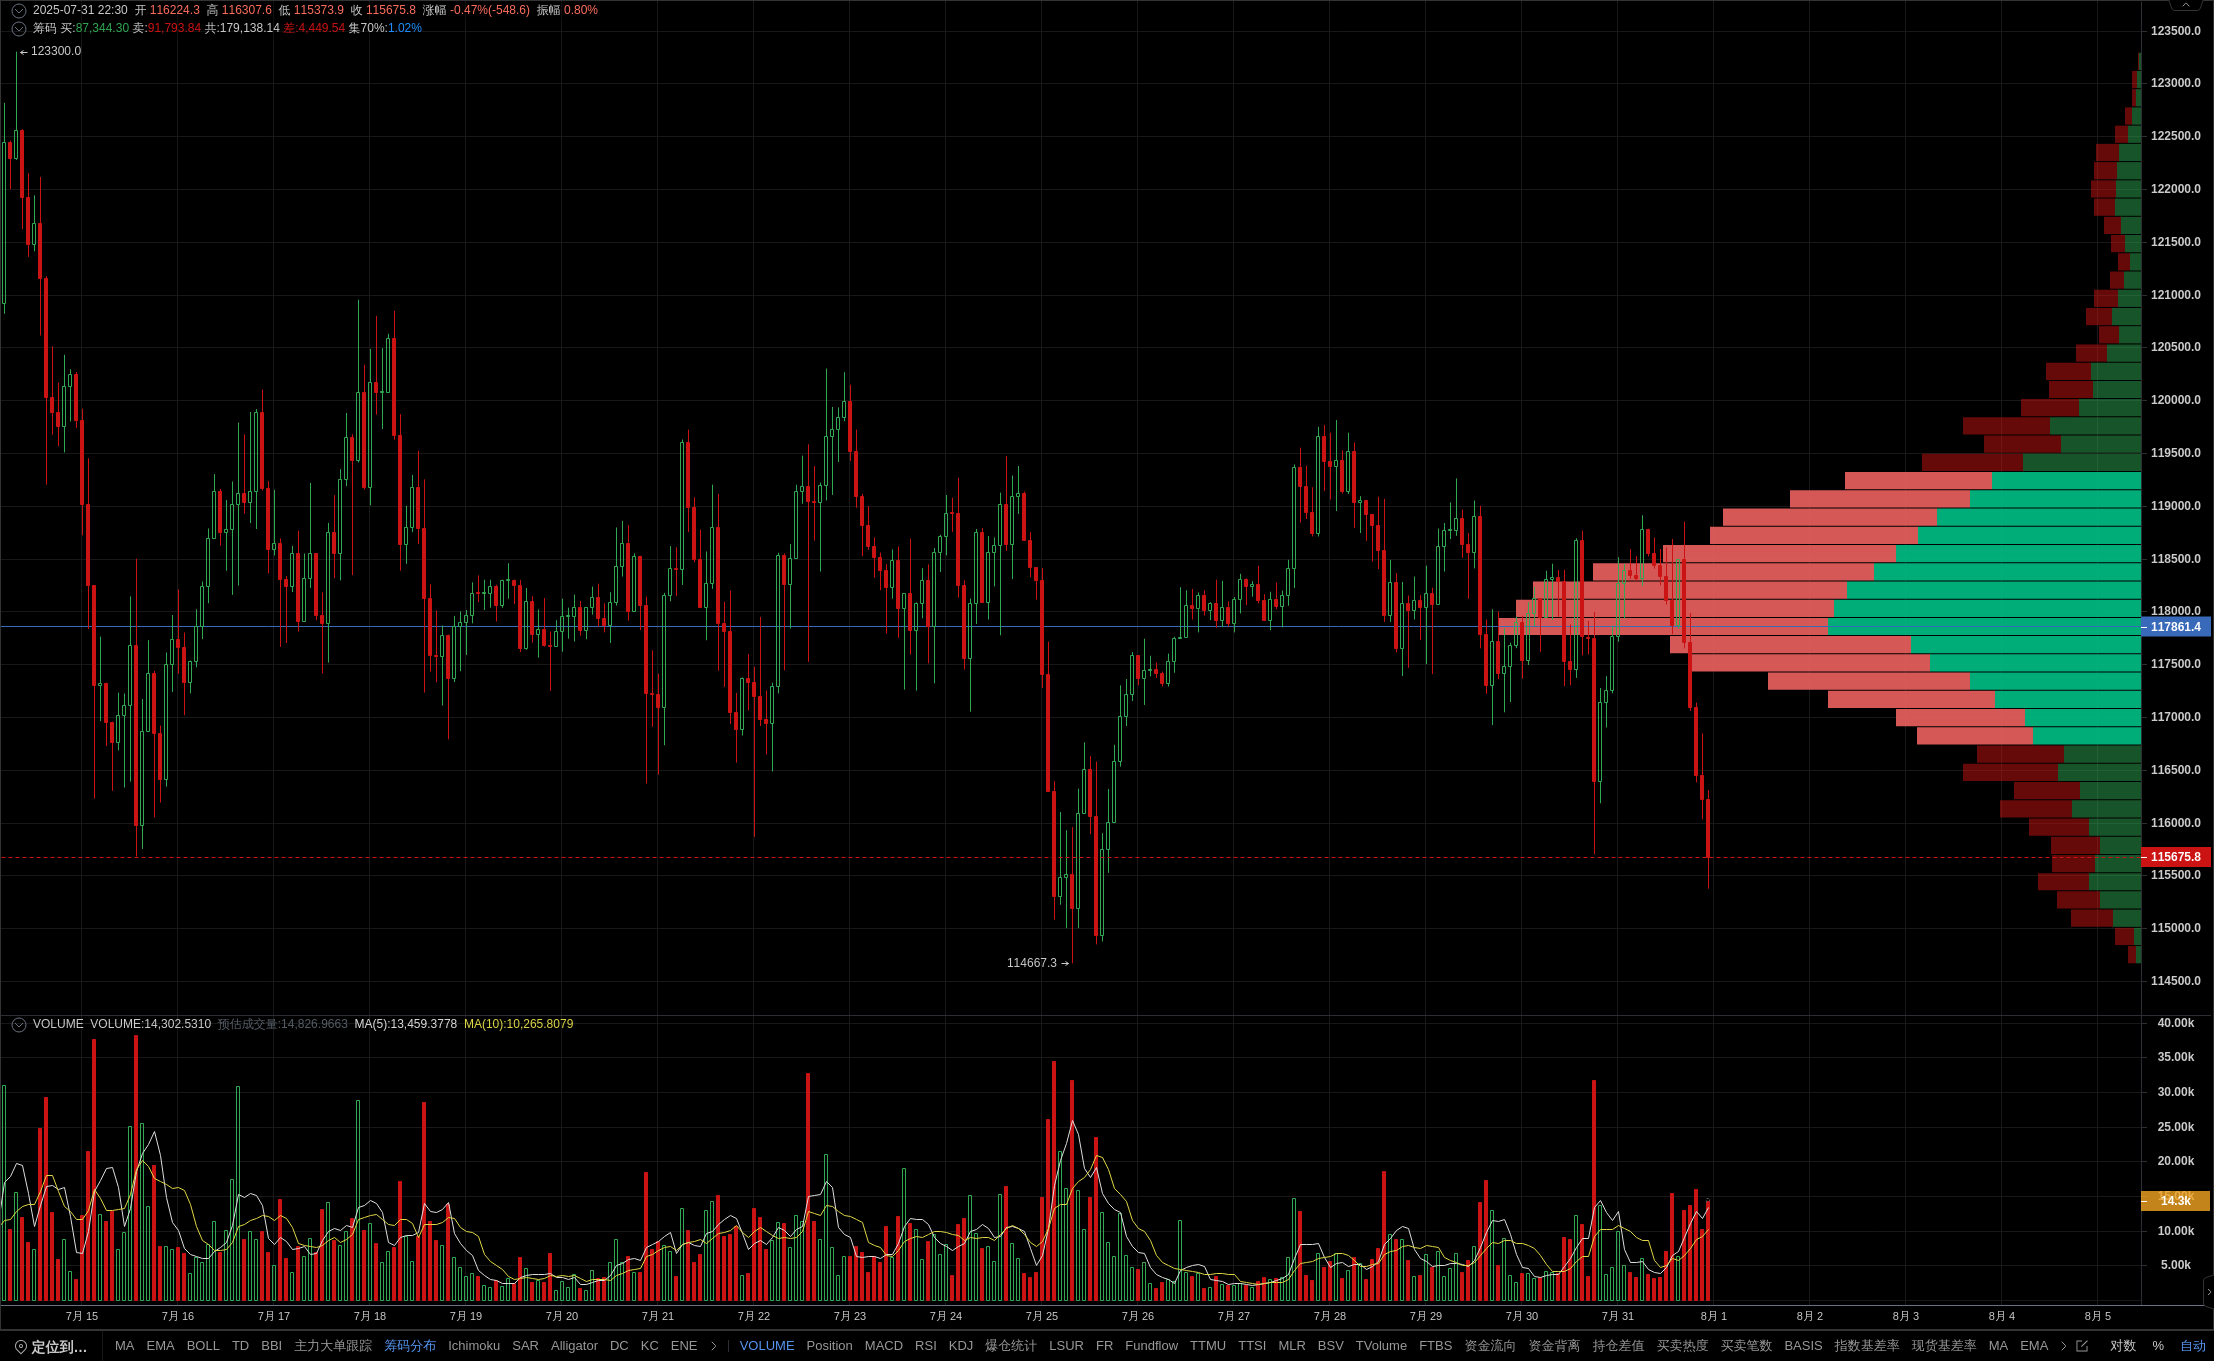
BTC under short-term pressure, black three soldier form releases strong bearish signal
The current 90 minute cycle K-line forms a black three soldier pattern, with three consecutive bearish candlesticks gradually decreasing in closing price. Member indicators show prices below the EMA24 and EMA52 moving averages, indicating a bearish trend in the medium to long term. At the same time, the distribution of chips shows strong resistance in the 118010-118319 area, indicating a significant weakening of market buying power and a low probability of rebound. The MACD bar chart continues to shrink, with increased downward momentum and RSI entering oversold areas, but there are no signs of bottoming out or divergence. The current trading volume has surged by 66%, indicating an increase in market activity, which may accelerate the downward trend. Open a membership, obtain precise resistance support levels, and grasp key operational points in a downtrend! The data is sourced from the PRO member's [BTC/USDT Binance USDT perpetual 90 minute] candlestick, for reference only, and does not constitute any investment advice.
