The divergence of ETH's main funds is intensifying, and the key point of the 2-hour cycle is about to break through
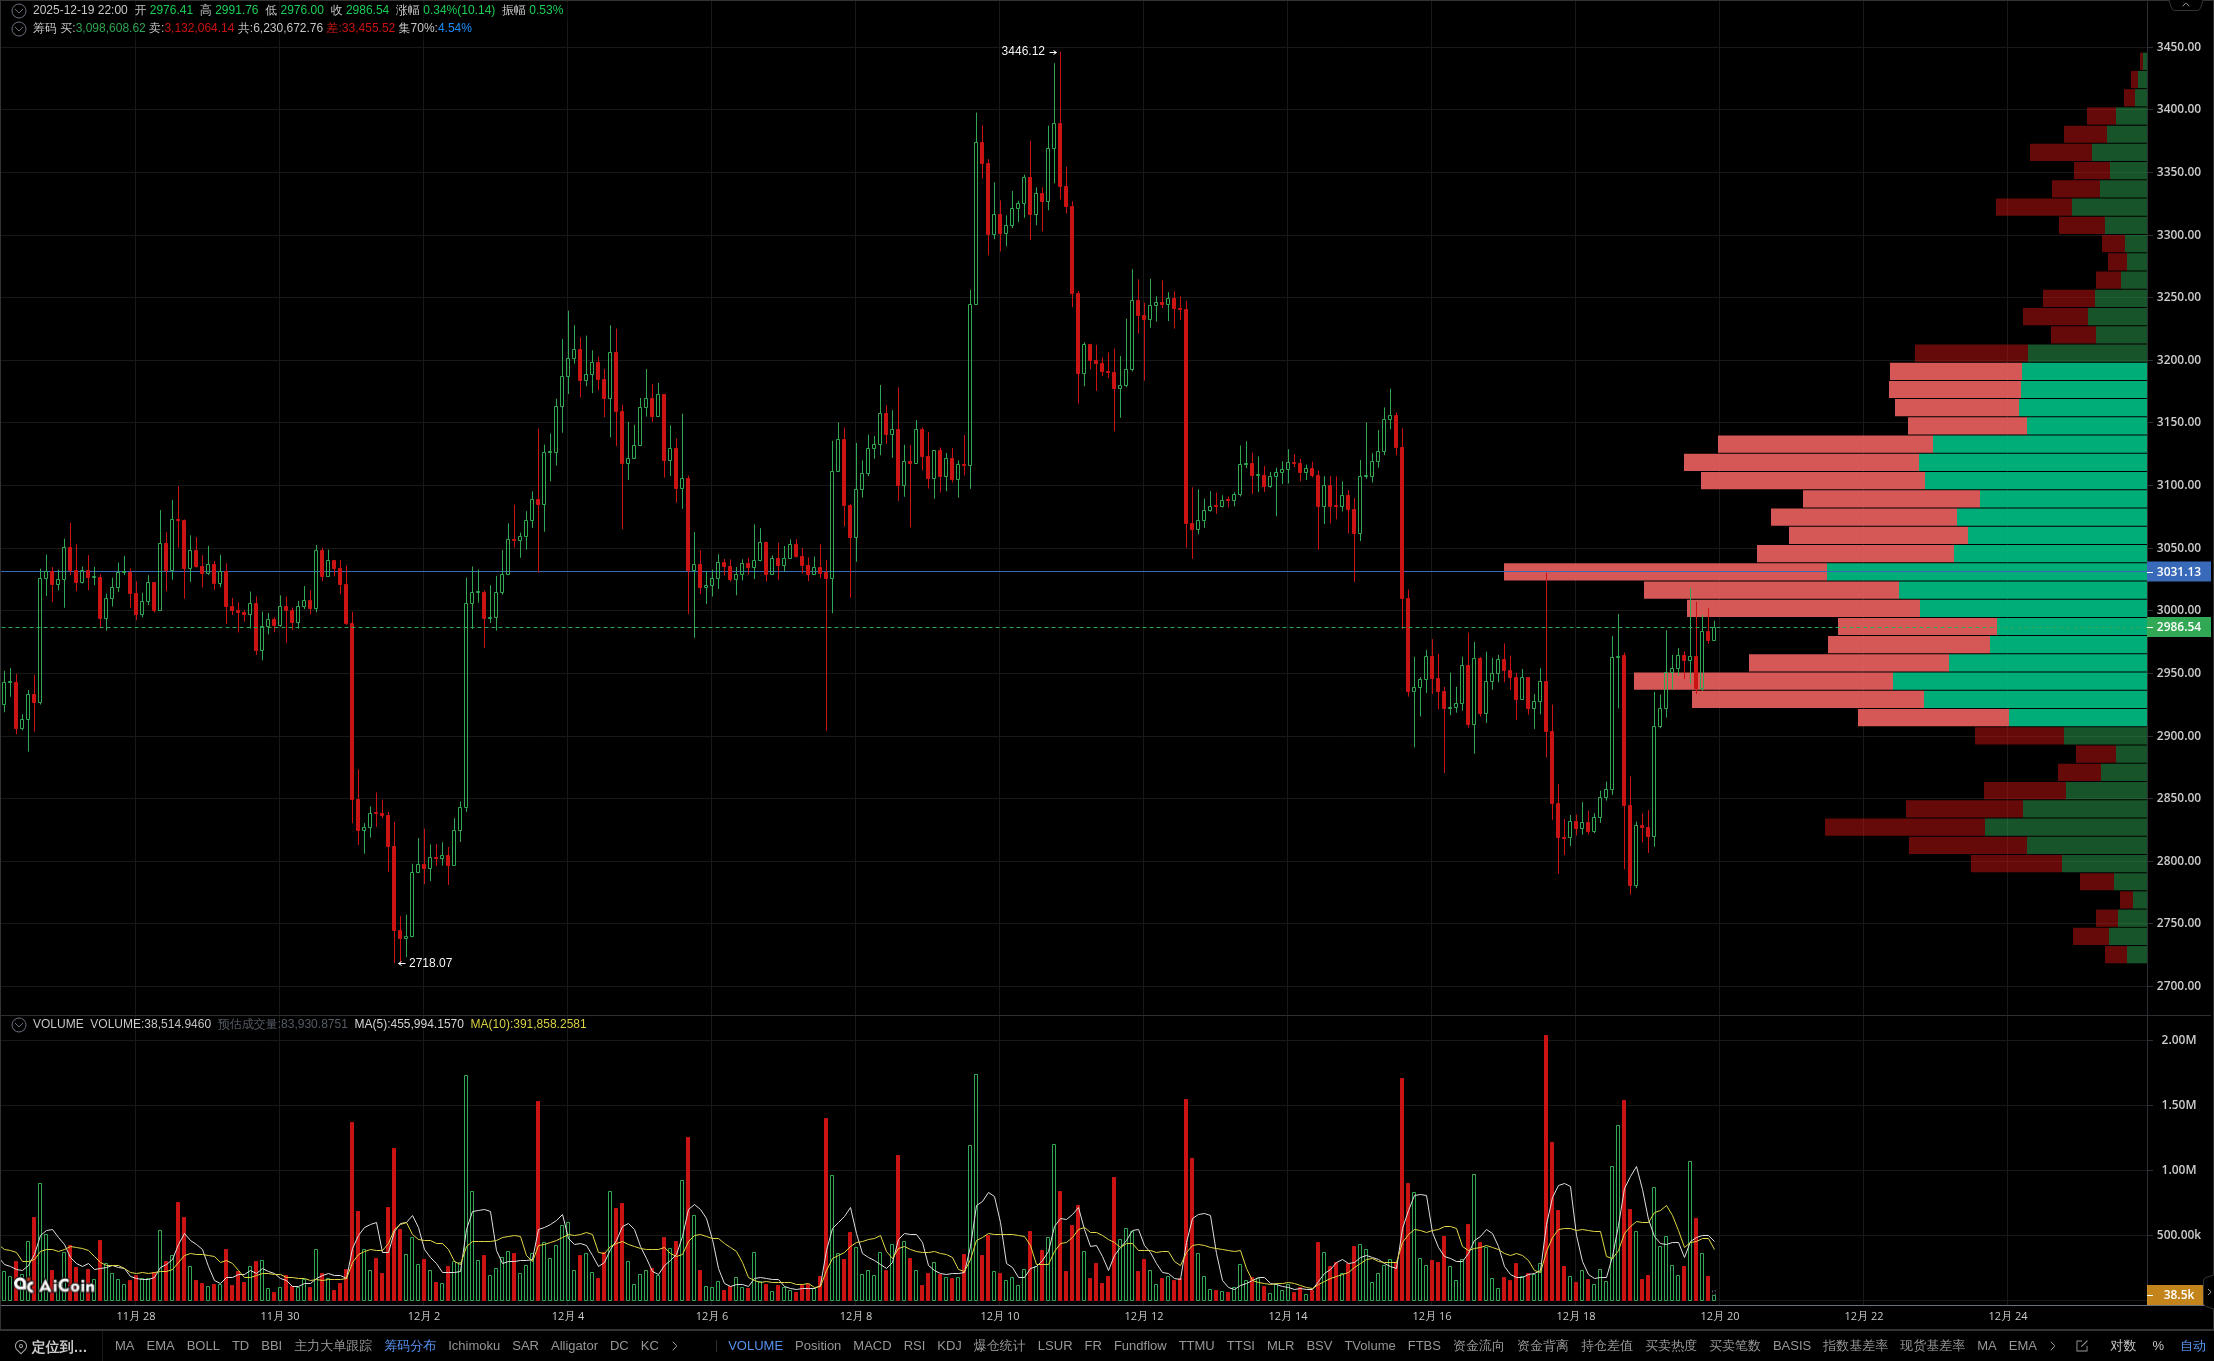
The current membership indicators show that ETH has formed strong support in the range of 2947-2961, with a trading volume concentration of 7.72% and a slight advantage in buying. However, the latest 2-hour candlestick has shown a peak pattern, and although RSI has broken through the upward trend line, it is accompanied by an extreme contraction in trading volume and a decrease in market interest, indicating insufficient upward momentum. The MACD bar chart shows a double peak, with EMA24 below EMA52, indicating a weak mid to long term trend. If the price falls below the 2947 support, it may accelerate its downward trend to 2927.5. Pay attention to the performance of chip intensive areas and be wary of bearish pressure. Member indicators accurately capture support resistance levels, helping you lock in trading opportunities in advance! 🎉 50% off year-end pet fans for limited time 🎉 The data is sourced from the PRO member's [ETH/USDT Binance USDT perpetual 2-hour] candlestick, for reference only, and does not constitute any investment advice.