Loading...
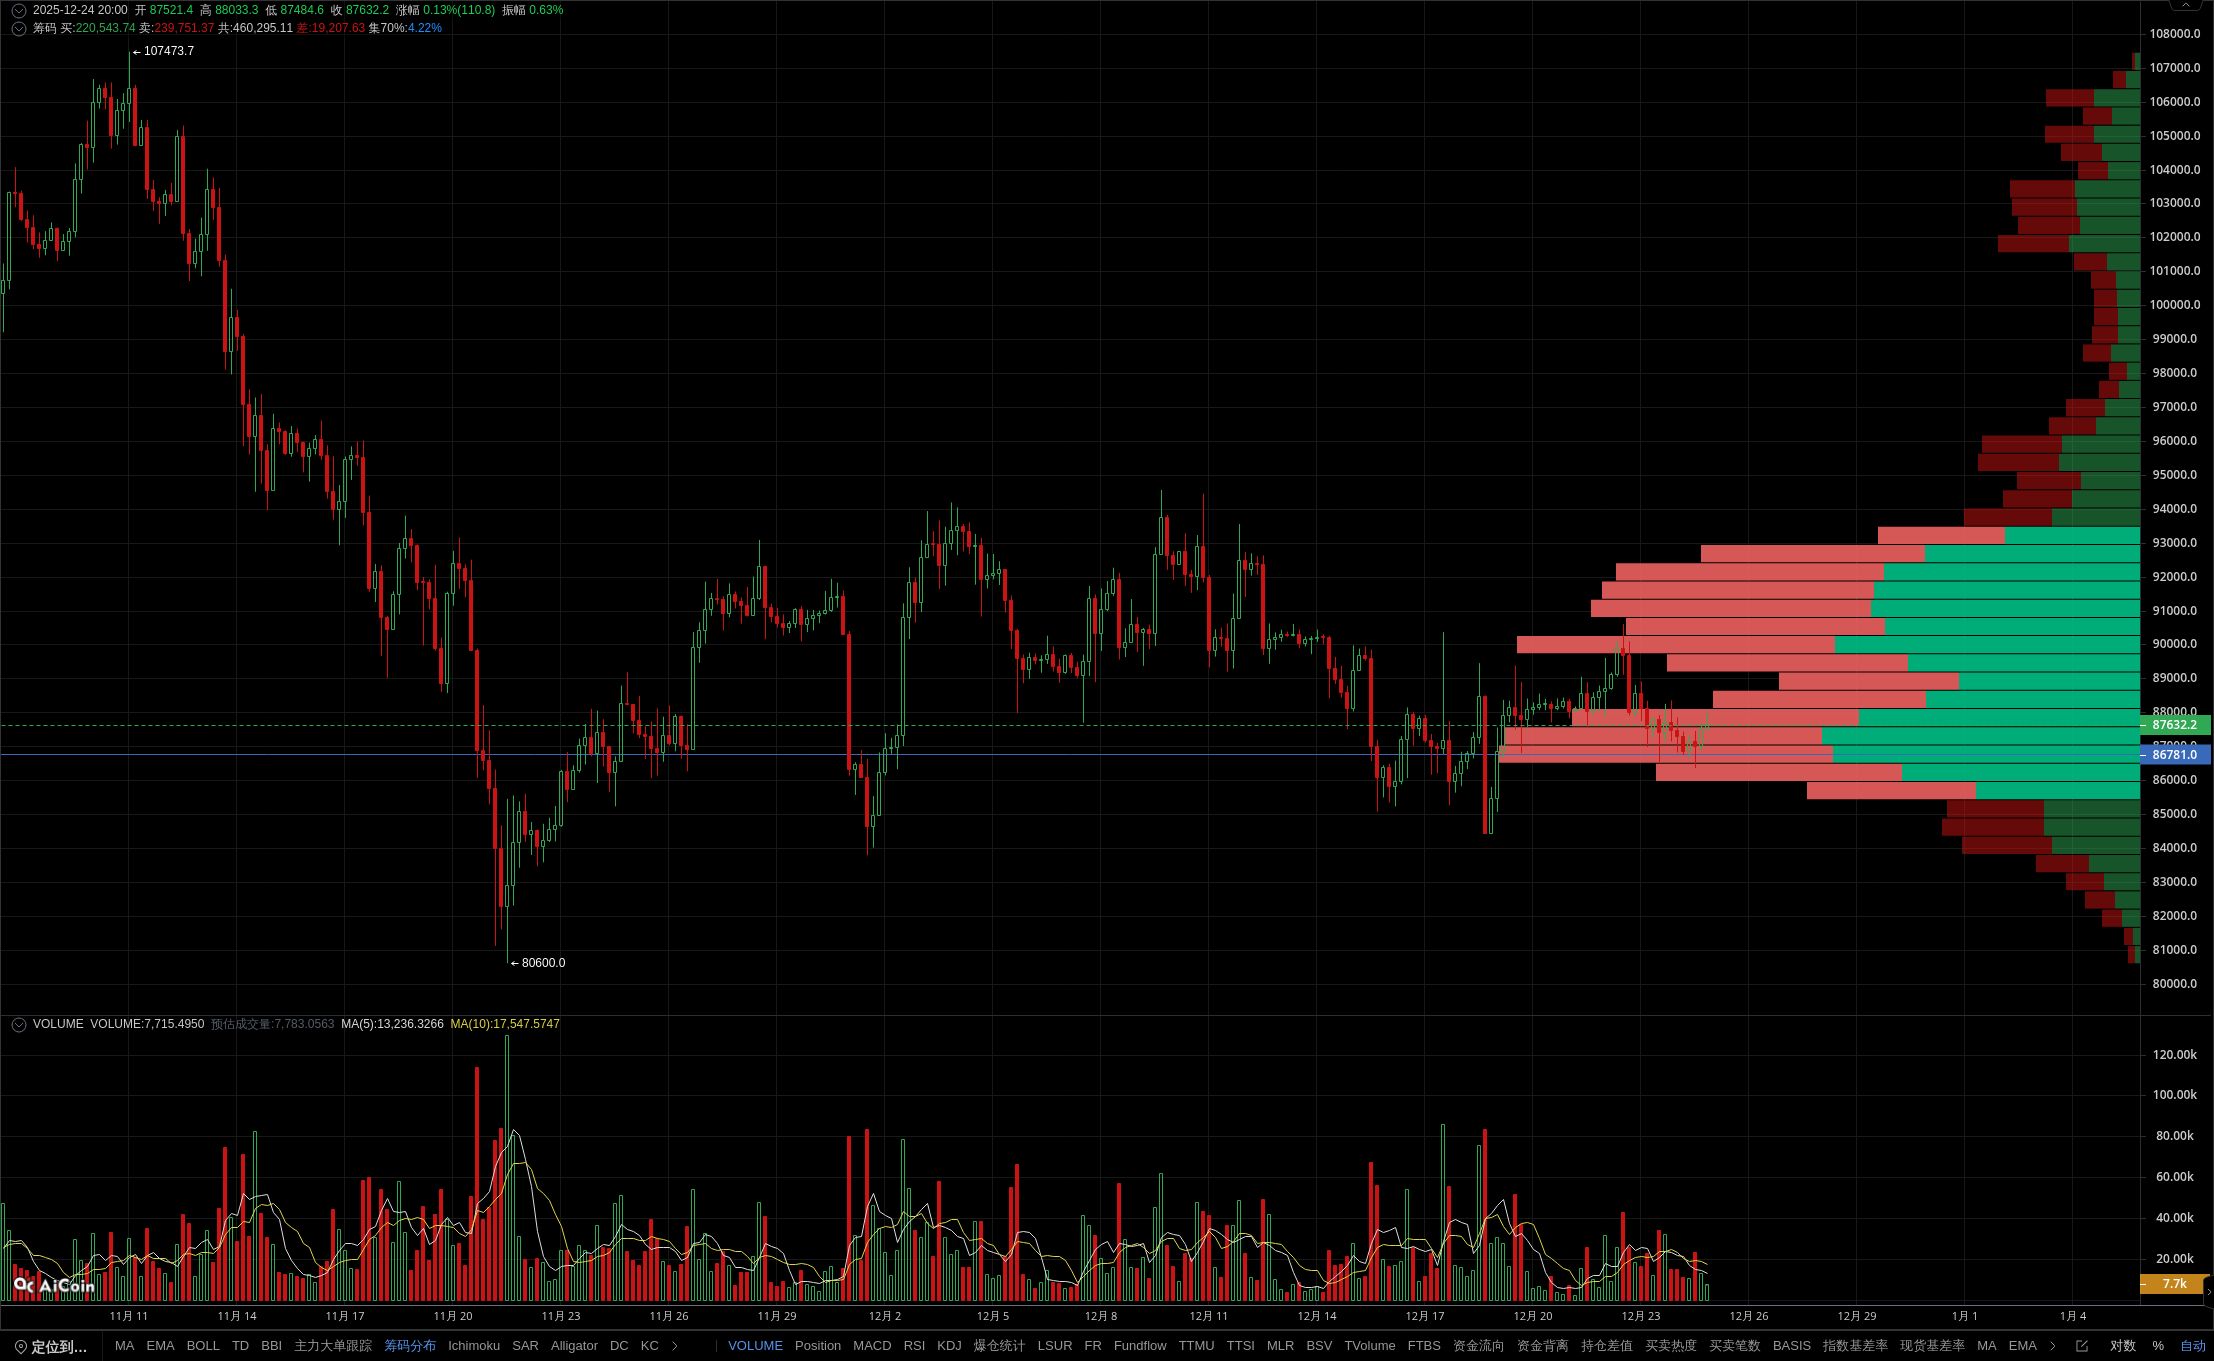
BTC short-term trend under pressure: key support levels may become a long short watershed
--
Member indicators show that the current BTC price is below the EMA24 and EMA52 moving averages, and the 4-hour cycle K-line forms a black three soldier pattern, releasing a strong bearish signal. At the same time, trading volume has shrunk to 41.75% of the recent average level, and market activity has significantly decreased, further confirming downward pressure. The distribution of chips indicates that the 87070-87194 area is a strong support band, and if it falls below, it may accelerate the downward trend of 86946. The resistance above is concentrated around 88060.5. Although KDJ has a golden cross, the growth of the MACD bar chart suggests insufficient rebound momentum. Pay attention to the effectiveness of support, if it falls below, the bearish trend will continue. Open membership and accurately capture key points and trend signals! The data is sourced from the PRO member's [BTC/USDT Binance USDT perpetual 4-hour] K-line, for reference only, and does not constitute any investment advice.