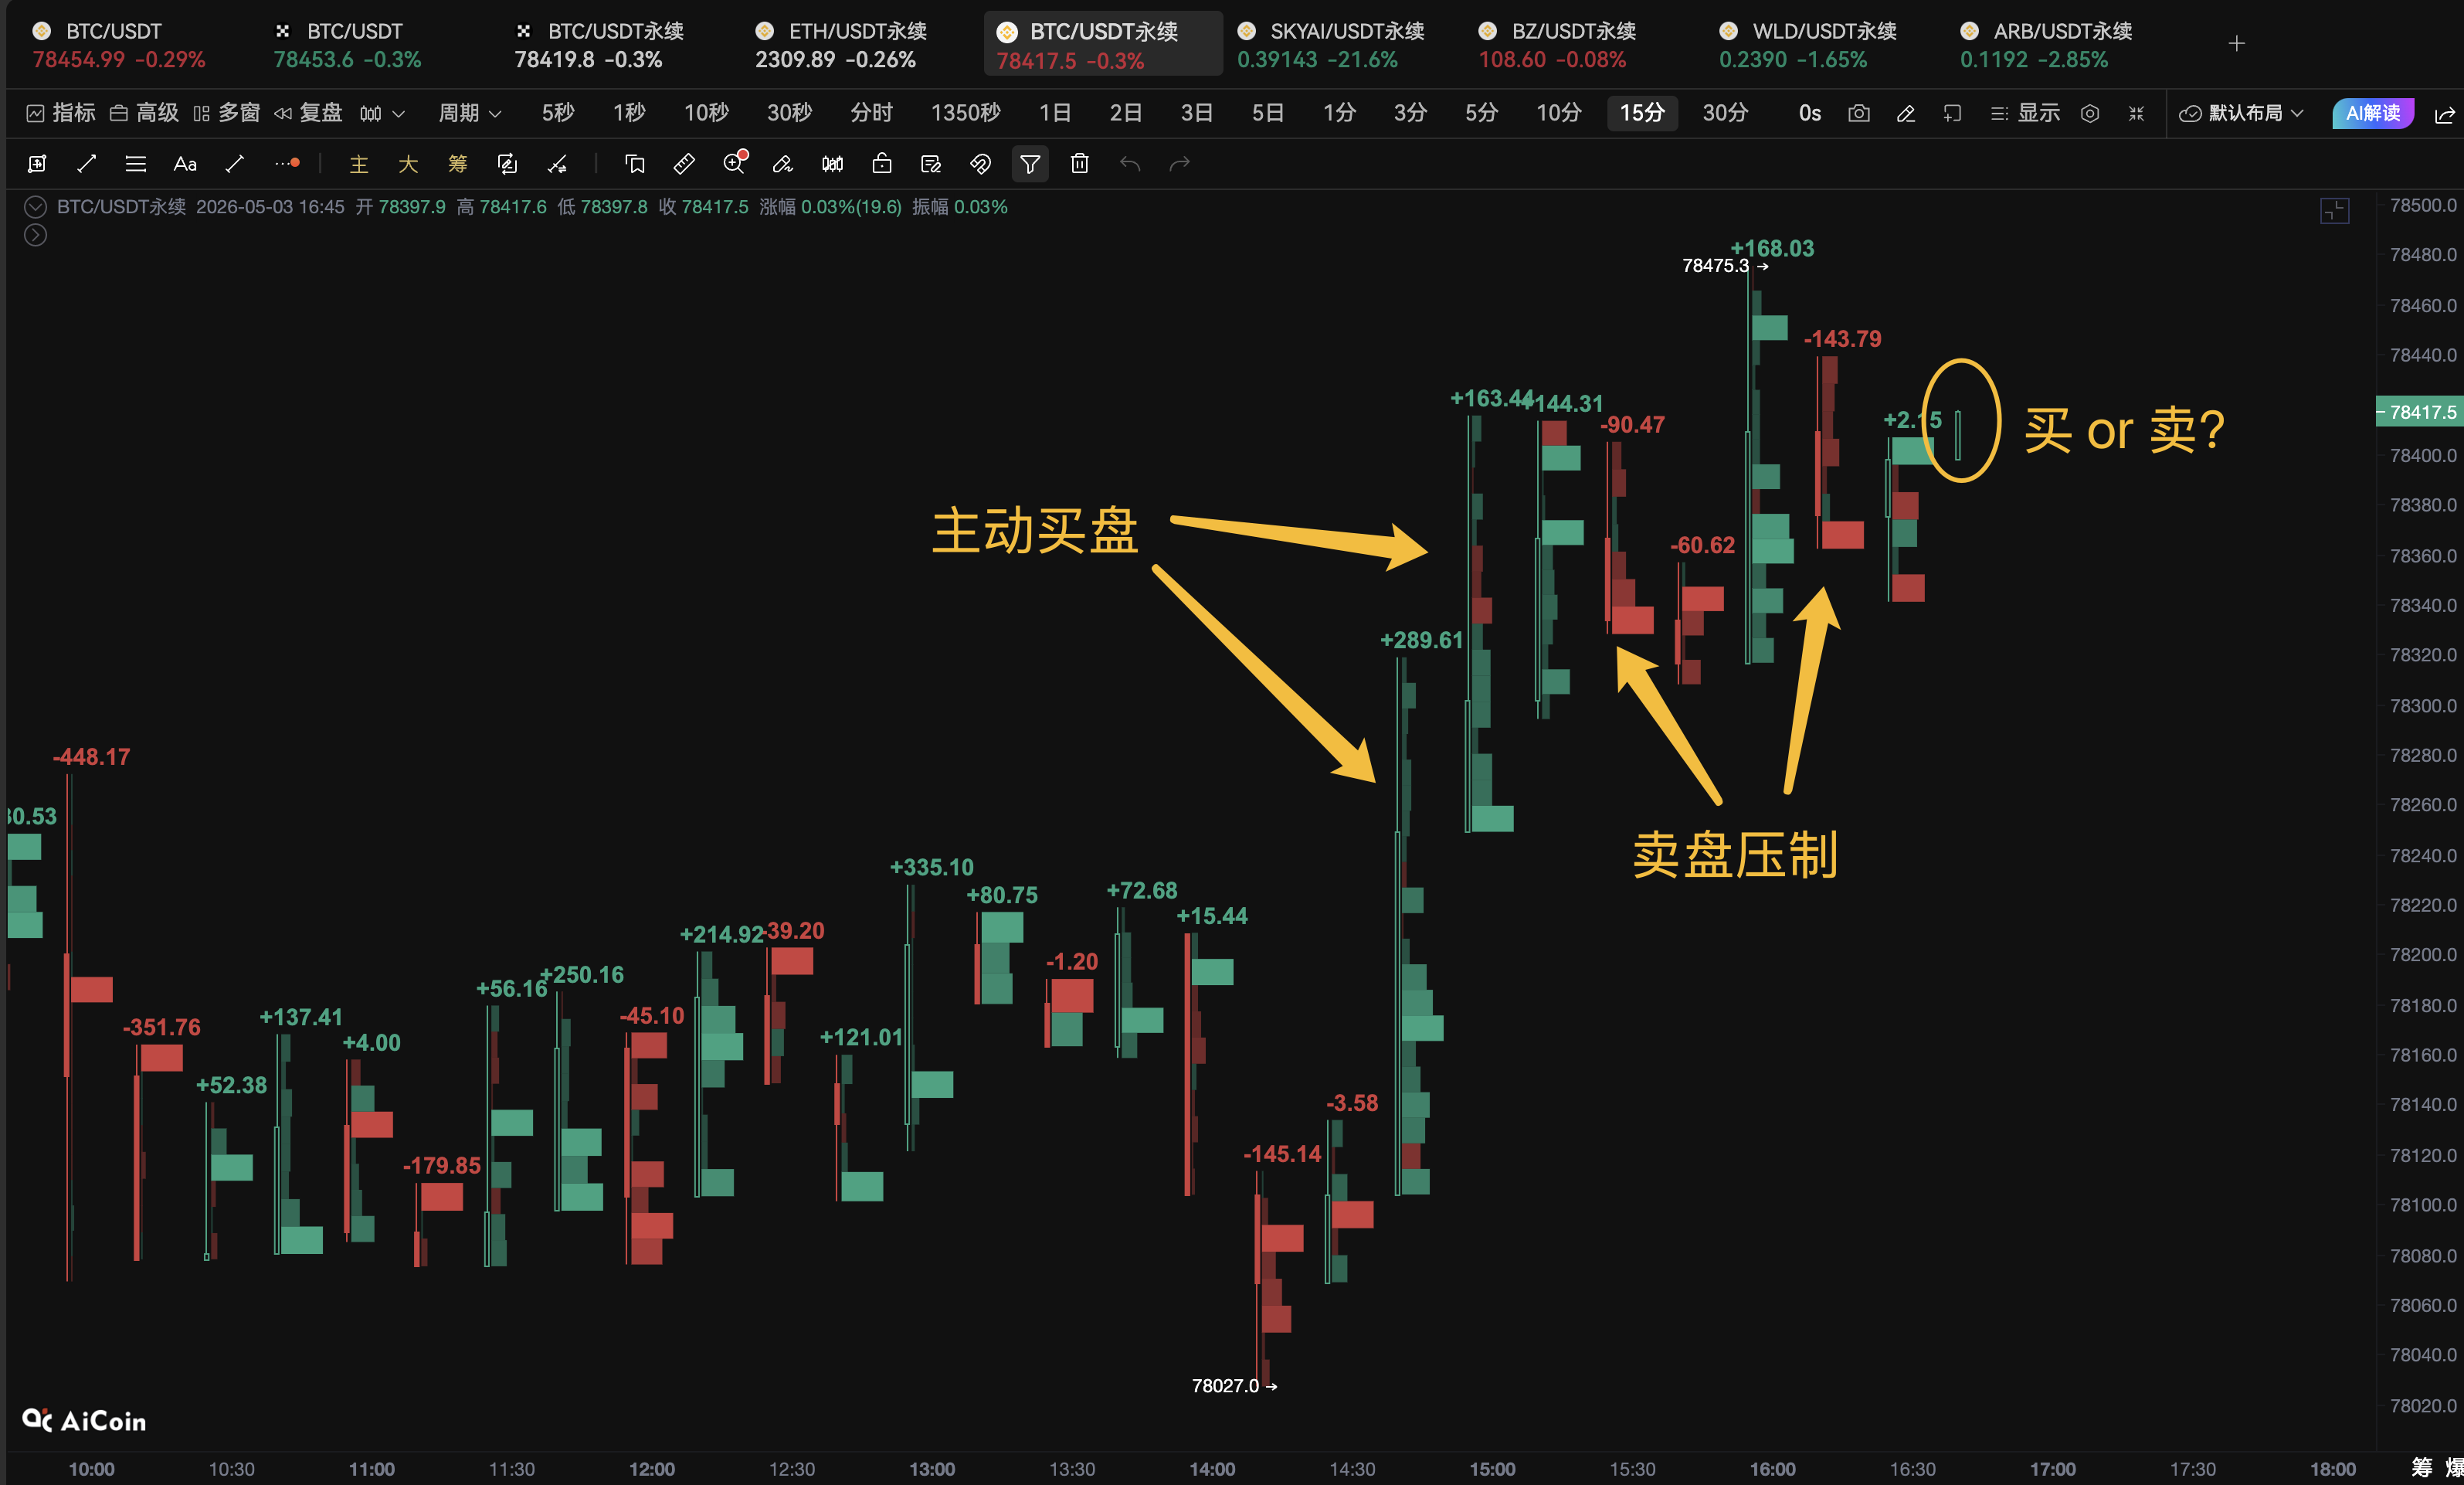
At this moment, the BTC footprint map is sending out divergent signals
The BTC 15 minute footprint chart shows that the current structure has undergone significant changes: In the recent rebound, there were consecutive active buying orders of+289,+163, and+144, with prices rapidly rising and bulls taking the initiative at one point. However, during the upward trend, negative Delta values of -90 and -143 began to appear simultaneously, and the momentum of high-level promotion significantly decreased. Now: bulls are pushing, but there are people taking orders from above. The order flow has shifted from one-sided buying to long short hedging, and divergence has emerged. Next, we need to closely monitor whether to continue amplifying the positive Delta to complete the long takeover, or to turn the negative Delta enhancement into suppression. The true dial change signal will be provided first in the footprint diagram. Now open PRO membership and immediately use the "Footprint Map" indicator to see every extreme Delta and order flow tilt. The data is for reference only.