Loading...
CtrlK
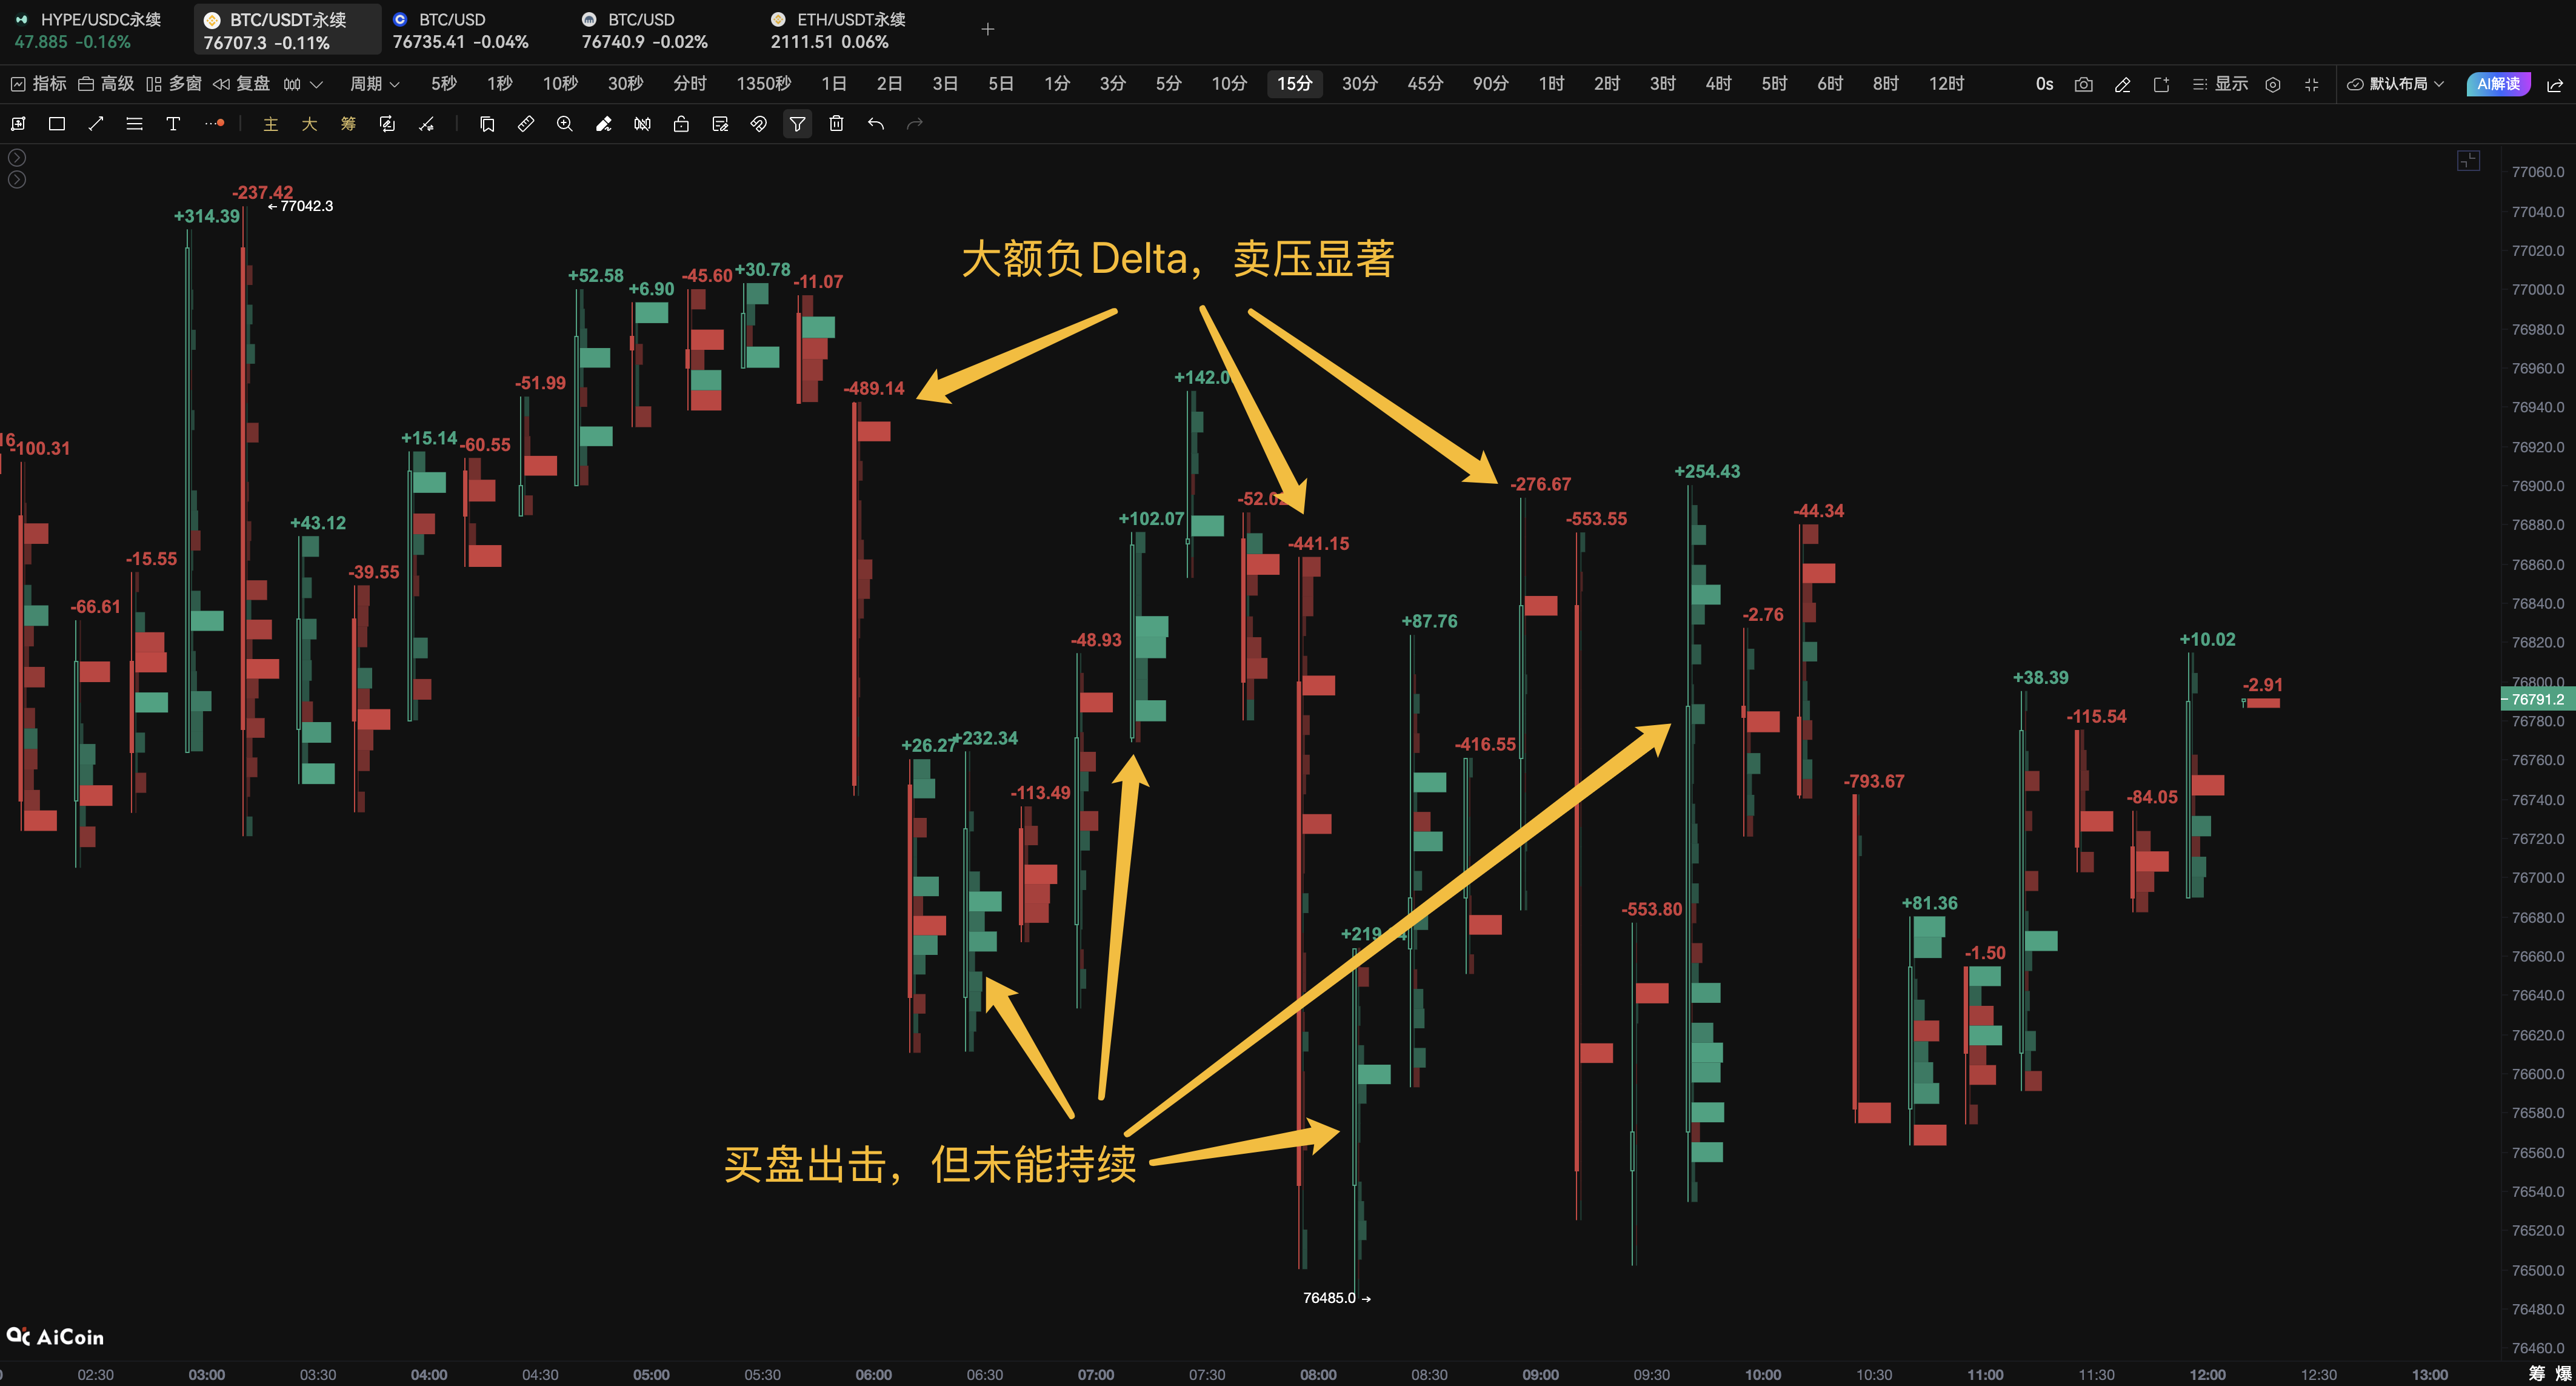
The BTC 15 minute footprint chart shows that there were intermittent positive Delta buying orders such as+219 and+254 during the trading session, but they were all swallowed up by large negative Delta orders at -416, -553, and -793 levels, indicating significant bearish selling pressure. However, it is worth noting that after multiple extreme negative Delta, the price did not continue to break through the low level, which means that there are still funds to undertake the low level, and the current market has entered a typical main force confrontation game zone. In this market trend, ordinary candlesticks often distort, but the footprint chart can directly show: -Is the market actively buying or actively selling -Which declines are real market crashes and which are just market washouts -Whether the bears have depleted and whether the bulls have started to take over Especially when the extreme negative Delta cannot continue to lower the price, it is often an important precursor to short-term fluctuations. By opening a PRO membership now, you can unlock the latest BTC order flow, Delta anomalies, and other situations, helping you stay one step ahead and seize opportunities!