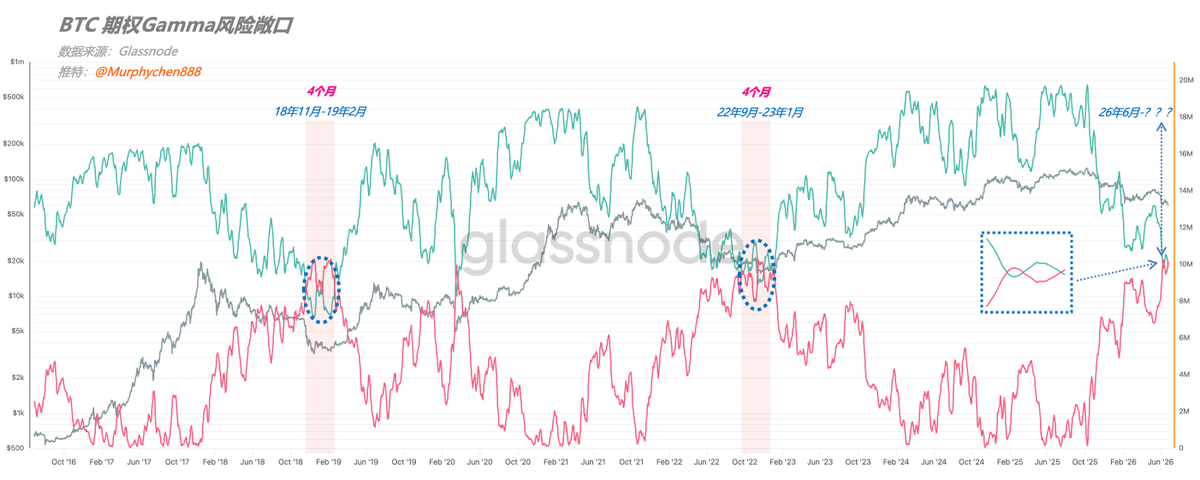
Profits and losses continue to converge, structure resetting in progress... When this signal was first shared on June 10, BTC was around 6-6.1w, and today it’s still hovering around the same level. Currently, the red and green lines are still tangled with each other, which means that when the supply of profits and losses is roughly 50/50, bulls and bears are fiercely battling it out. Historically, similar situations often correspond to cyclical bottom zones. Unfortunately, it can only provide us with a vague area signal, not a precise timing signal. Looking at past data, it usually takes about 4 months for the first convergence of profits and losses to completely separate (see Figure 1). Moreover, within 1-2 months after the first convergence, there’s often a “final dip.” For this cycle, the first convergence occurred in early June this year. If we simply follow the pattern, it suggests that around July-August, BTC might challenge the lower limit once more, with a potential drop of -10% to -15% from the current price. Damn! This actually aligns somewhat with the "three-line convergence" from the mystical indicators... Could it be that fate is at work here?