Loading...
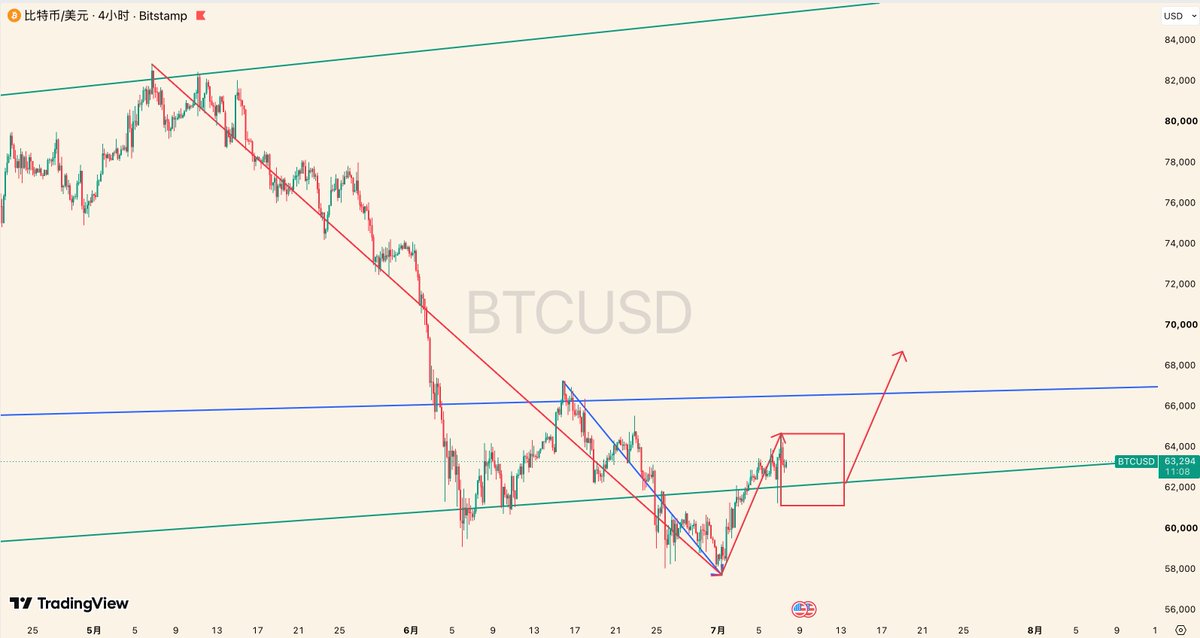
BTC Market Analysis 2026.07.07 Last week, we mentioned that if BTC breaks through 63730, the rebound would expand to target the entire red downward segment in Chart 1. Subsequently, BTC rose to 64700 before pulling back, and last night it briefly broke below the green Gann angle line 3/1 (62000) before recovering. What's next? This week, continue to monitor the support role of the green Gann angle line 3/1 (62000). As long as the daily & weekly candlestick bodies can close above this level, the movement starting from 64700 is likely a pullback targeting the 57800-64700 rise. After the pullback ends, there’s at least one more segment of the same-level upward movement. If BTC can gather momentum and break through the blue Gann angle line 2/1 (66700) and stabilize above it, it might even develop into a new upward trend. The green Gann angle line 3/1 (62000) is the lifeline. If this week’s weekly candlestick breaks below it and fails to reclaim this position afterward, then the movement starting from 57800 is merely a small-scale rebound targeting the blue downward segment in Chart 1. Under this path, 57800 cannot serve as a phase low point.