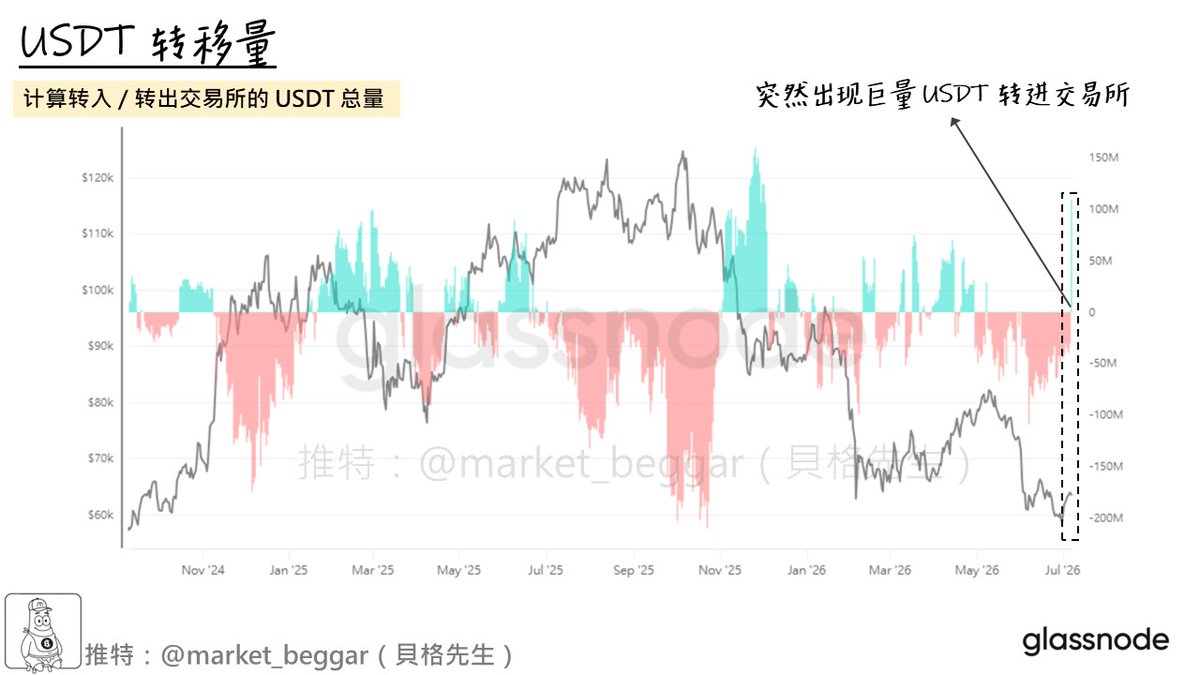
The reinforcements of the rebound market: the sudden appearance of a huge amount of USDT Continuing from the previous Liq technical analysis post (citation below), Since Monday, the volatility of BTC has significantly increased, The market seems to have started a new round of pricing due to the news of Strategy selling BTC. However, the evaluation I made in the following quote still maintains the original verdict, And currently there seems to be a signal that improves the success rate of Retest .. : // The indicator in the attached figure is the total amount of USDT inflows/outflows from the exchange, For the convenience of observation, I smoothed it with SMA (30), The indicators themselves are mainly used to observe the willingness of funds to buy at the bottom. Here, let me help you review the core concepts of indicators: ➡️ Large amount of USDT flowing into the exchange: indicating a significant increase in market willingness to buy at the bottom ➡️ Large amount of USDT outflows from the exchange: indicating that funds are making profits and exiting the market ➡️ Before the trend starts, it is usually accompanied by a large amount of USDT flowing into the exchange Detailed introduction of indicators : https://(((((((((x.com)))))))))/market_beggar/status/1994220064774729883 // I also shared this indicator with you on March 31st this year, The main core view at that time was that during the 60-80K consolidation period, there was a lack of enthusiasm for funds, And through this, I would like to emphasize the viewpoint that 'the last tremble must come' to everyone, Interested friends can refer to the analysis post at that time : https://(((((((((x.com)))))))))/market_beggar/status/1994220064774729883 Time goes back to the present: Just yesterday, I noticed a sudden surge in the USDT transfer volume indicator, This indicates that a relatively large amount of USDT has been transferred to centralized exchanges in the market, According to the principle of indicators, this may indicate that there are already funds willing to sell BTC Based on the trend deduction I mentioned in the following citation (partial original text, please refer to the following citation for details): one ️⃣ Can BTC successfully complete Retest in the 58-61K range in the future two ️⃣ If Retest is successful, there is a high probability that the target in the band is a 68K Liq three ️⃣ Continuing, if Liq rises to 68K, it is important to pay close attention to whether there is a bearish Stop Hunt We can draw the most important conclusion of this article: If returned to the designated Retest area, the massive influx of USDT may increase the success rate of Retest Therefore, the signal shared in this article synchronously increases the probability of cleaning 68K Liq // But I still want to remind everyone here ⚠️: The massive inflow of USDT is not a cyclical bottom indicator, But it's a medium-term band indicator, we can't do it because of the huge influx of USDT, To determine whether the cyclical bottom has arrived. In other words: The massive influx of USDT into the exchange is an absolute bullish factor, But the subsequent rise may be a temporary rebound or a true cyclical reversal, We can only confirm the probability of a short-term increase through this indicator, As for whether it is a 'staged rebound or cyclical reversal', it needs to be evaluated based on other information. Another form of bottoming out where the probability of "replacement resonance" gradually increases https://(((((((((x.com)))))))))/market_beggar/status/2074311132463219062 In summary: Even if the success rate of Retest is improved, we still need to pay attention to the Stop Hunt risk at 68K, At that time, other signals (such as line type, on chain data, etc.) will still need to be transmitted, To determine whether my ideal 'last little tremble' can occur as scheduled. Finally, as the old saying goes: Although it has not yet fallen to our ideal 'deep bear valuation bottom fishing zone' (see the end of the article for details), But the triggering of the 'two periodic bottom signals' is already a fact: ➡️ PSIP < 50%(https://(((((((((x.com)))))))))/market_beggar/status/2063800180227588374) ➡️ AVIV Heatmap enters the blue area (https://(((((((((((x.com)))))))/market_gegar/status/2071773101898223809)) Therefore, as cyclical traders, even if we know that the best window to sell has not yet appeared, But it is also necessary to always guard against the potential risk of empty mindedness caused by "excessive wishful thinking". The above is today's content, hoping to be helpful to everyone // Related reading resources Cointime Price, a legendary tool for bottom fishing in cycles, has experienced historical retracement https://(((((((((x.com)))))))))/market_beggar/status/2074678322546814985 Epic Cycle Bottom Valuation Resonance: Second Bottom Exploration on Schedule https://(((((((((x.com)))))))))/market_beggar/status/2070324576526139573 ETH Large Level Liq Analysis: How to Combine BTC Data to Determine Bottom https://(((((((((x.com)))))))))/market_beggar/status/2072501388635189342 BTC Long and Short Term Holder Cost Reversal Signal: Simple Data Calculation https://(((((((((x.com)))))))))/market_beggar/status/2072136661434307014