--
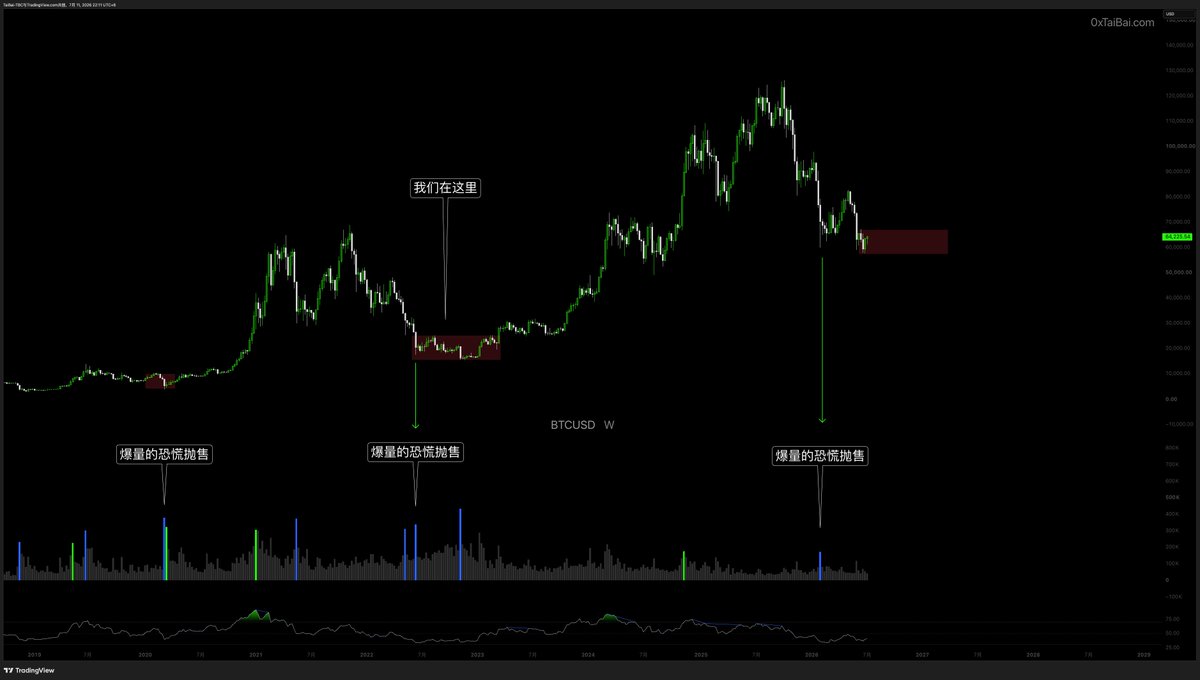
BTC Weekly Spot Analysis No trading on weekends, time to study and learn Analyzing spot price and volume with the 'carving a mark on a boat to find a sword' method The marked positions on the chart Share common technical characteristics After a period of decline, there's massive selling at the lows (high volume + large bearish candles) Followed by a long bottoming process, leading to a new bull market In other words, Massive panic selling is a signal of shakeout or bottom accumulation While we can't say this is the absolute bottom yet, there are initial signs Summary: We're already in the late stage of the bear market *Chart uses COINBASE spot price data GoDiscord