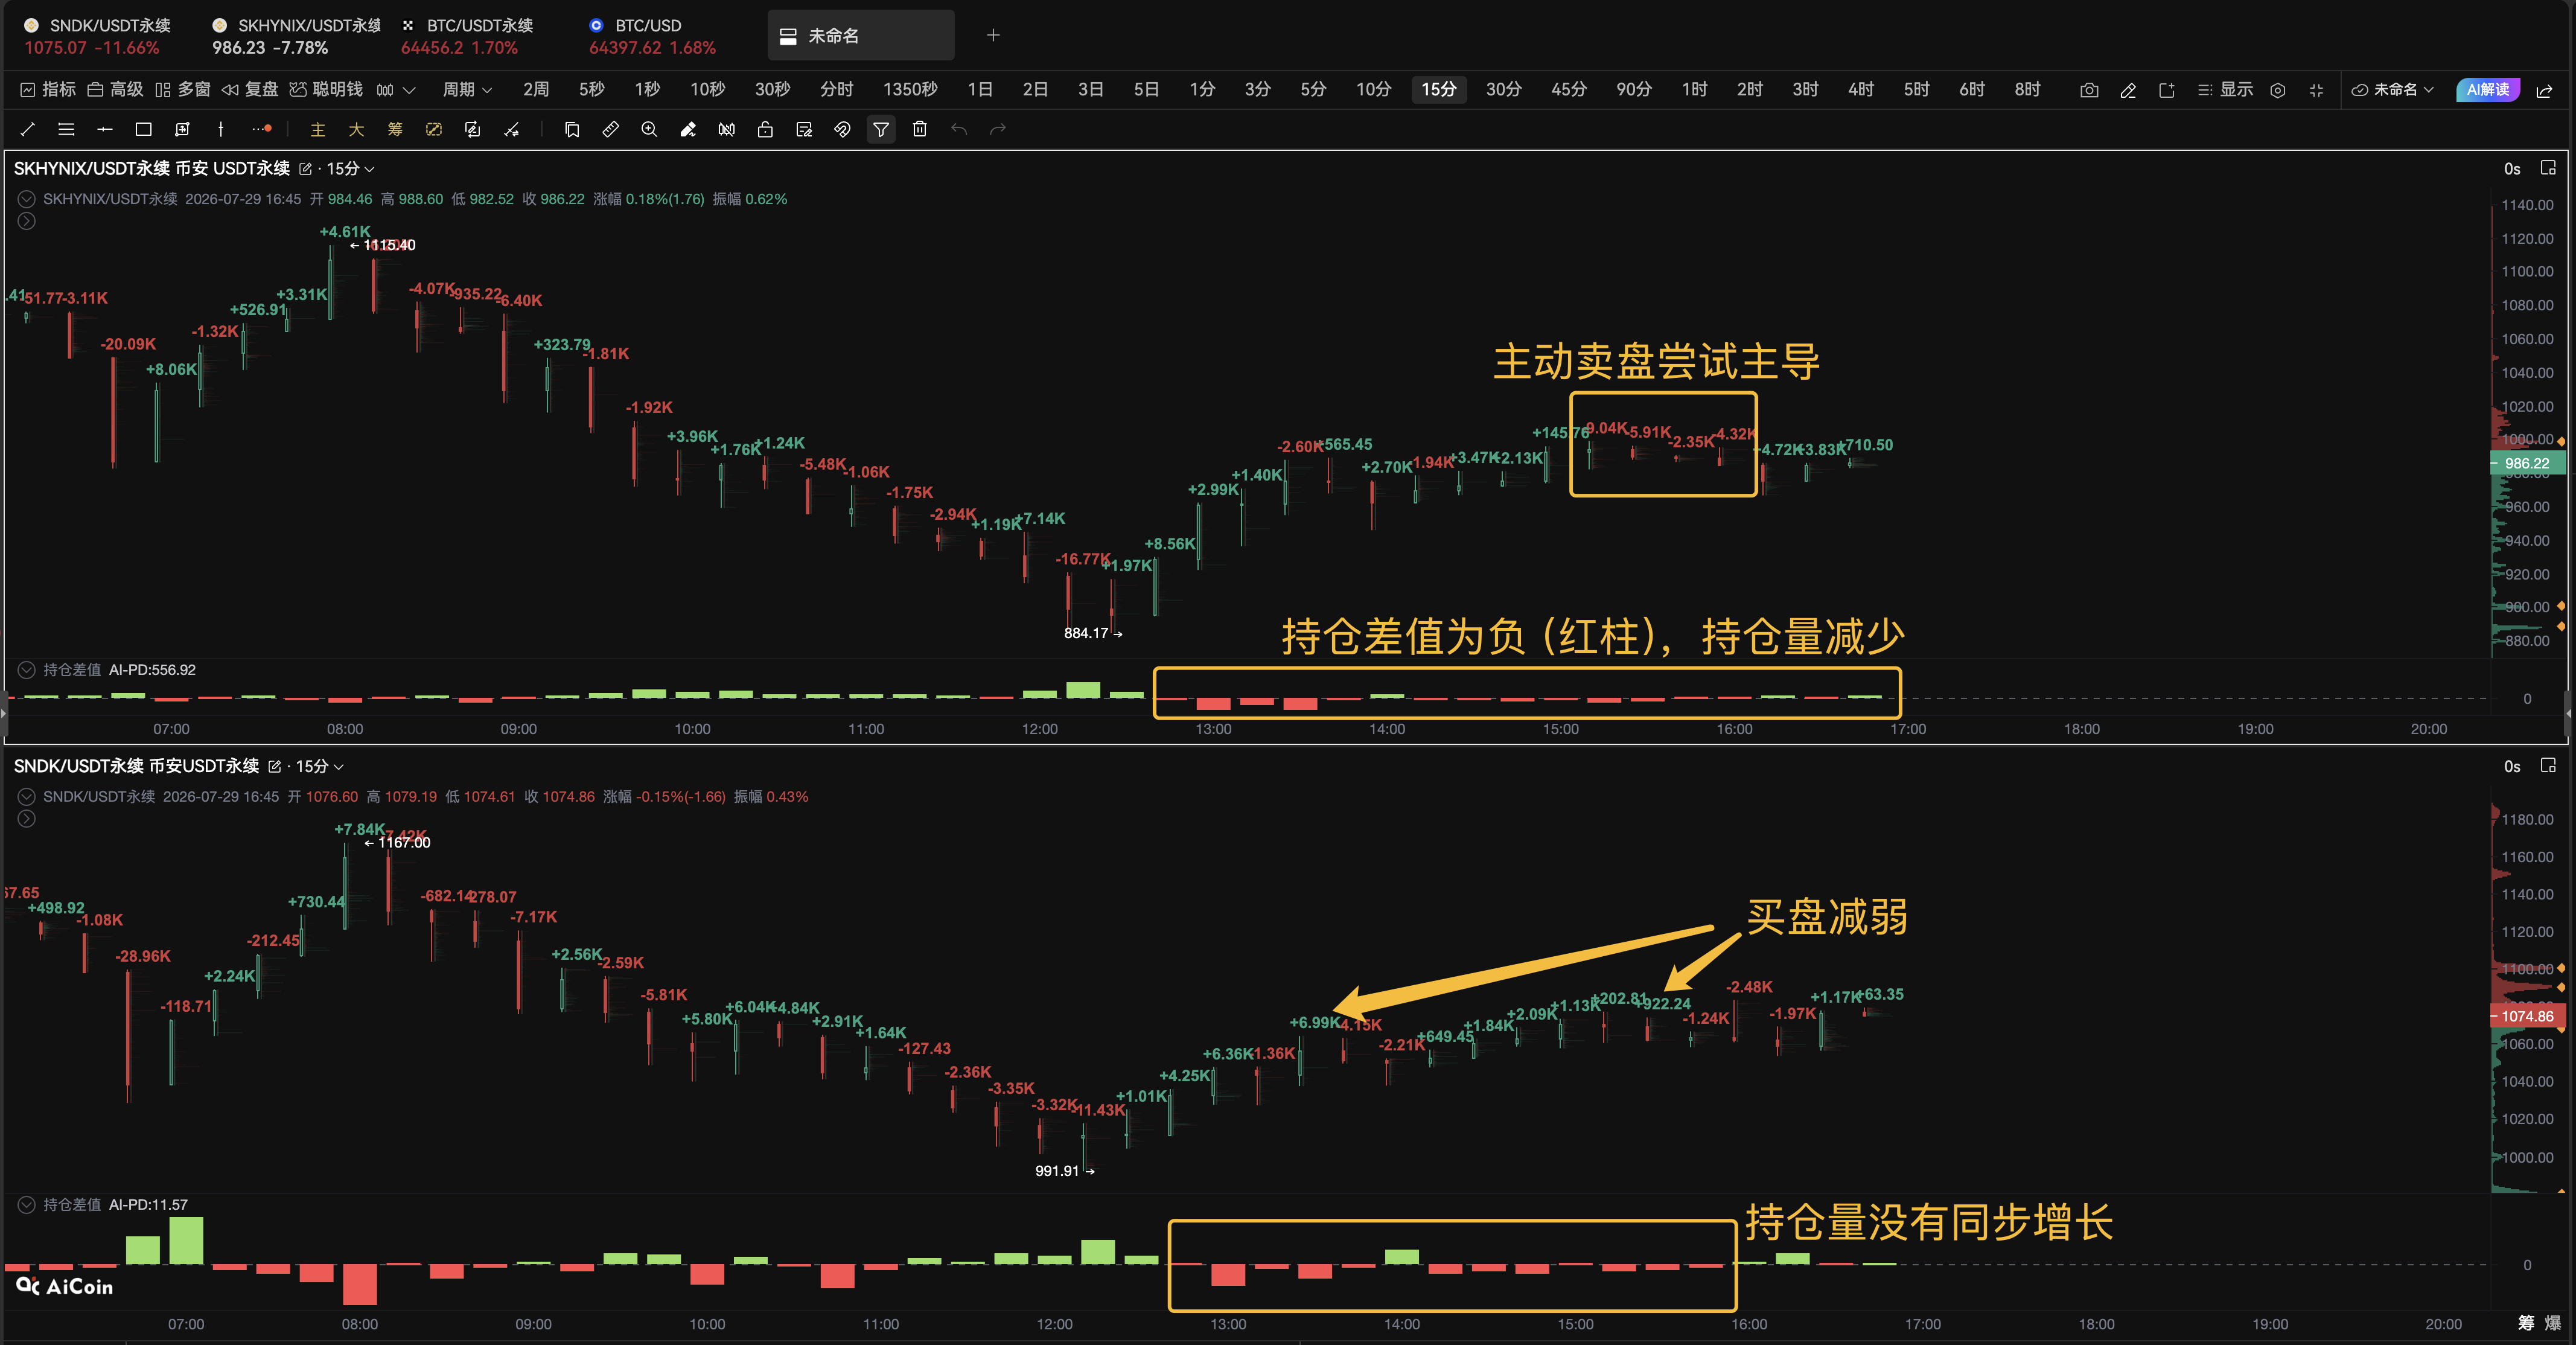
SKHYNIX and SNDK rebounded, but the footprint map did not confirm a reversal
SKHYNIX and SNDK are both rebounding at low levels, but the PRO "footprint map" shows that active buying is weakening. -SKHYNIX: Short term consecutive negative Delta of -9.04K, -5.91K, -2.35K, -1.63K, actively selling and attempting to counterattack; The synchronous decline in holdings indicates that the rebound lacks new funds and is more inclined to reduce holdings for repair. -SNDK: During the rebound period, there have been multiple positive Delta occurrences, but the latest Delta has significantly shrunk; The position has not increased synchronously, and the buyer's power is also insufficient. Next, only when the positive Delta is re amplified and the position increases synchronously, can the rebound be more credible; If the negative Delta expands again, be wary of selling and taking over again. The regular candlestick only tells you that it has rebounded, while the PRO footprint chart can reveal the buying and selling truth behind this rebound. -Positive Delta (green), stronger active buying; -Negative Delta (red) indicates stronger active selling. The data is for reference only and does not constitute any investment advice.