Loading...
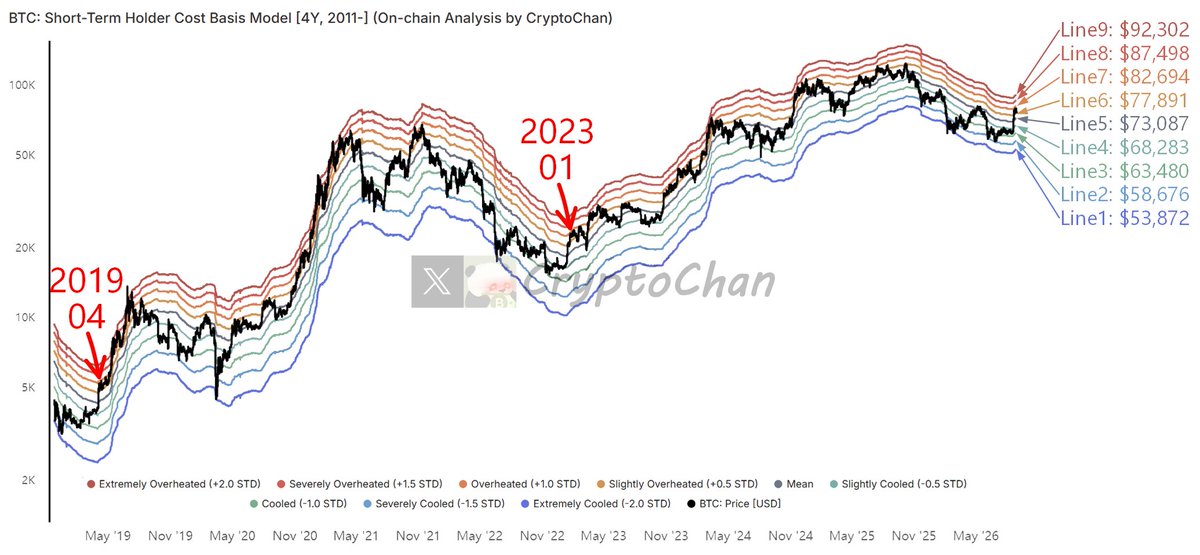
This wave of price action almost hit Line7, ️ below April 2019 & January 2023 ┌── On-Chain Data Details ──┐ The nine lines in the chart represent the average purchase cost lines of short-term holders' Bitcoin on-chain positions, with [+2, +1.5, +1, +0.5, 0, -0.5, -1, -1.5, -2] standard deviations.