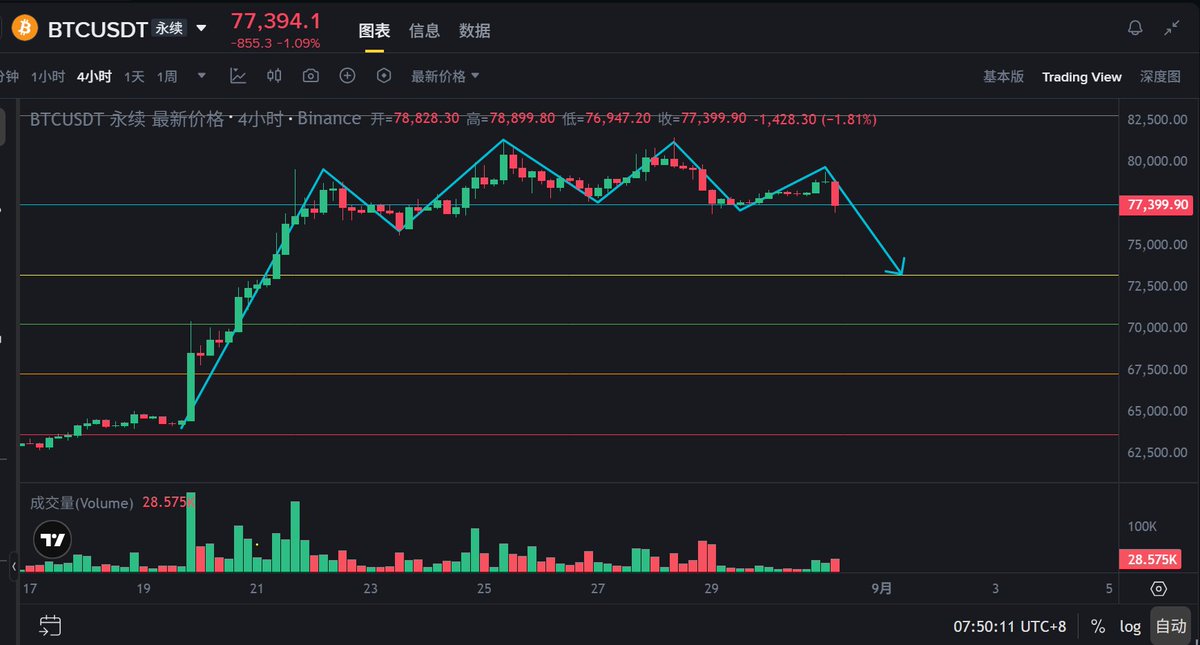
⚡️BTC started dropping even before Monday’s market opened❗️ What price level could trigger an accelerated pullback if it breaks below? Let’s take a look at the chart below. The price is currently in the 77K-82K range, forming a 4-hour multiple M-top structure. There’s heavy resistance above and several key support levels below that we need to watch closely: First line of defense: Around 77K. This level is last Friday’s low and the lower boundary of the weekend consolidation range, making it the nearest support level right now. If this level breaks with high volume, the short-term bullish structure will be damaged, and the price will most likely test the 75,000 level next. Second key level: 75K. If BTC breaks below 75K, the cumulative long liquidation pressure on major CEXs will reach $919M. Once liquidations of this scale are triggered, it could set off a chain reaction of “drop → long liquidations → forced selling → further drop,” accelerating the price decline. Mid-term structural pivot: 72K-73K. This is not only the Fib 0.382 retracement level but also the area where the daily EMA120 and the three-month structural bottom are located. If this level is decisively broken, the mid-term bullish structure will collapse, potentially opening up downside space to 68K-70K. Do you think Bitcoin will break below 75K and head straight to the critical mid-term structural pivot at 72-73K?