Loading...
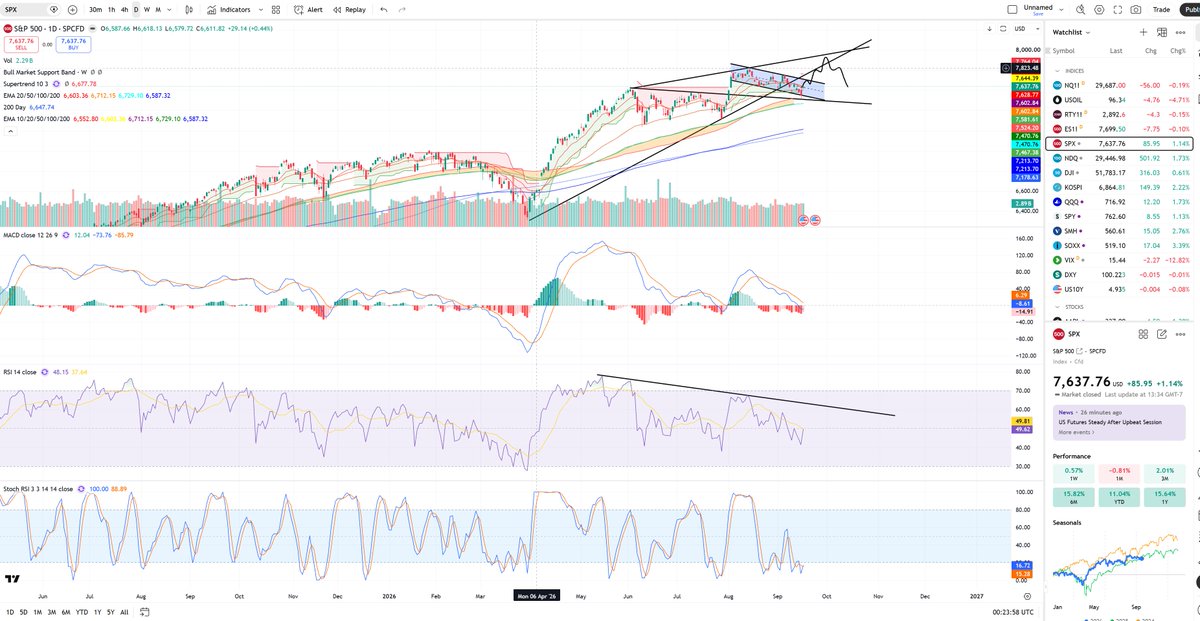
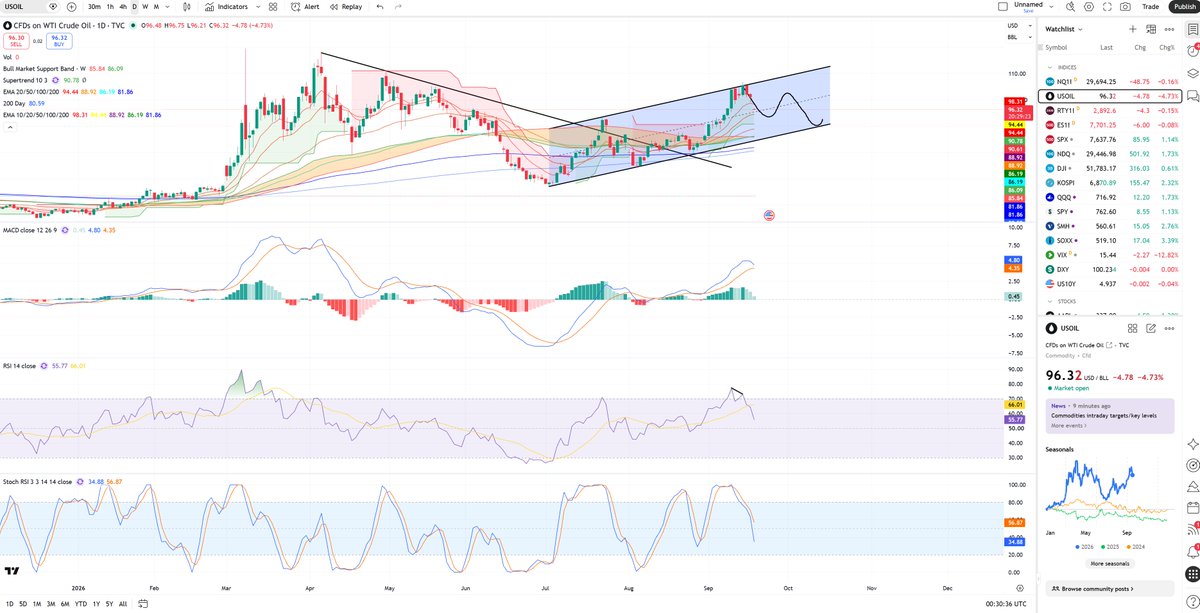
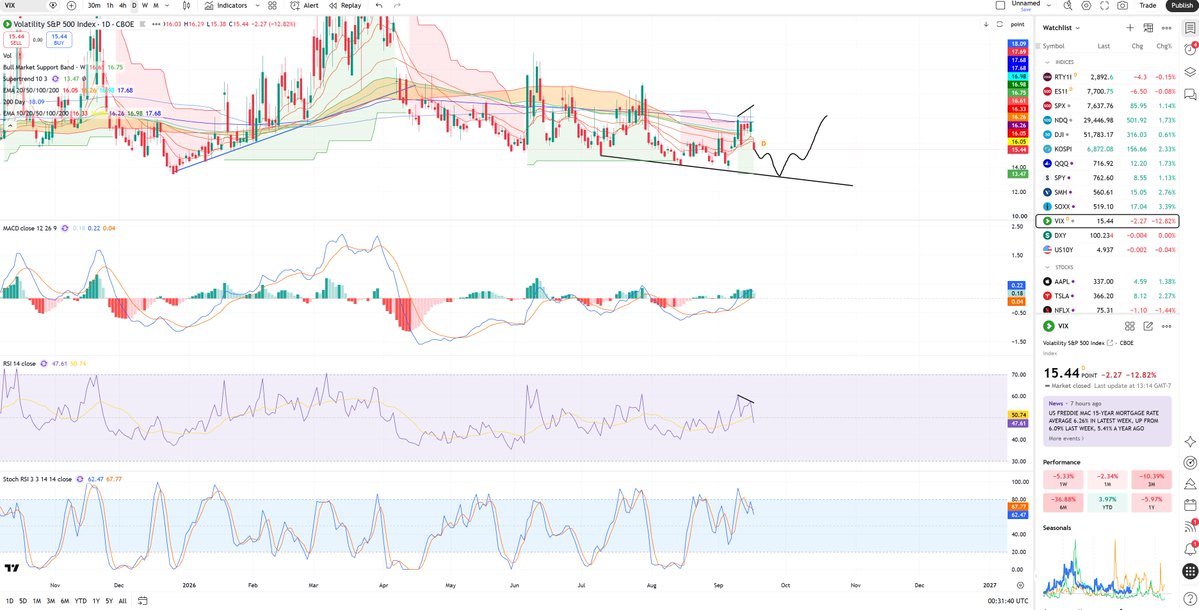
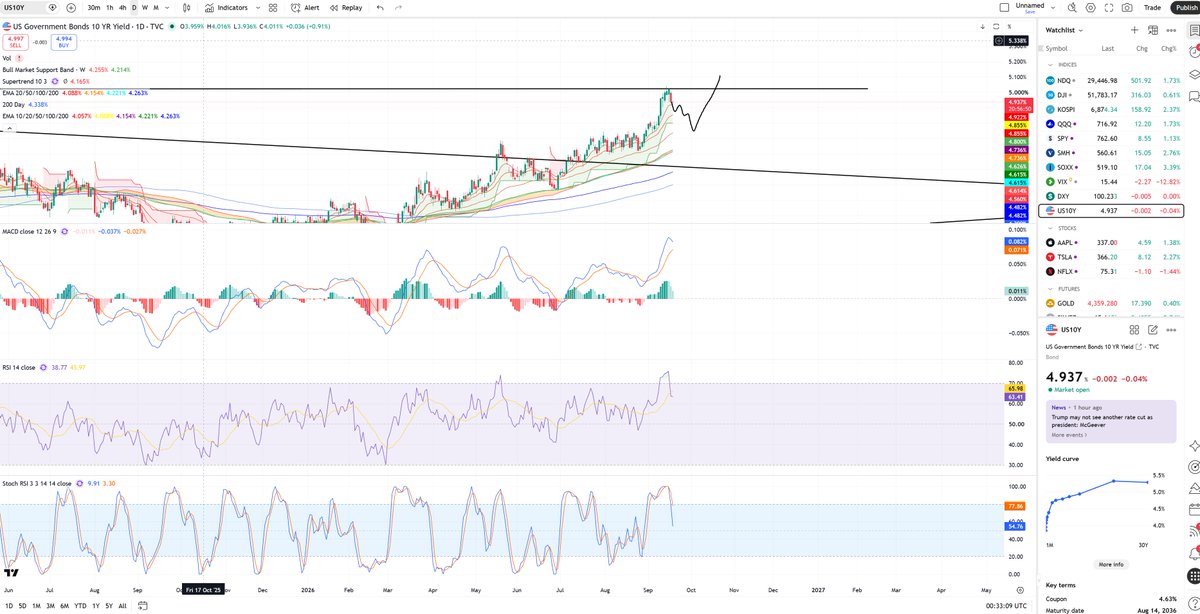
SPX Analysis Currently forming a 42-day bull flag structure. It had a fake breakdown at 7580 but quickly recovered. As long as it doesn’t break below the 7580-7600 range, I’m firmly bullish. If it does break below, watch for a retest of the trendline connecting March 30 and July 30. By the end of September, we could still see 7800-7850. If we connect June 2 and August 13, the upper resistance could reach a maximum of 7950 points. Checked QQQ’s movement as well, and everything looks fine. QQQ hit the 700 put wall to fill the gap, then broke through the downtrend line. Oil, U.S. bonds, and VIX all dropped as expected (both VIX and oil showed daily RSI bearish divergence, typically leading to a pullback within 3–5 trading days. It’s common to see a top form within 1–3 weeks, followed by a correction. Oil and VIX just confirmed RSI bearish divergence on Wednesday). VIX targets are 14.53 to fill the gap and 13.31. Oil’s lowest target is the lower channel at 87-88. For 10Y U.S. bonds, the short-term target is EMA 20 at 4.84%. For the broader market, QQQ is looking to fill the gap at 730. SOXX is targeting the gaps at 536 and 558. Basically, when oil drops, the market should rise. Overall, I’m bullish. If you’re considering going short, wait until next Thursday or Friday after the U.S. visit and sell the news. Then, we might see a brief pullback like May 14-19. Right now is not the time to be bearish. Yesterday at 10 AM, when the AAII investment survey came out showing 53% bearish and only 28% bullish, that was the signal to immediately switch to bullish. #SPX #QQQ #SOXX #VIX #Oil #Investing #Trading