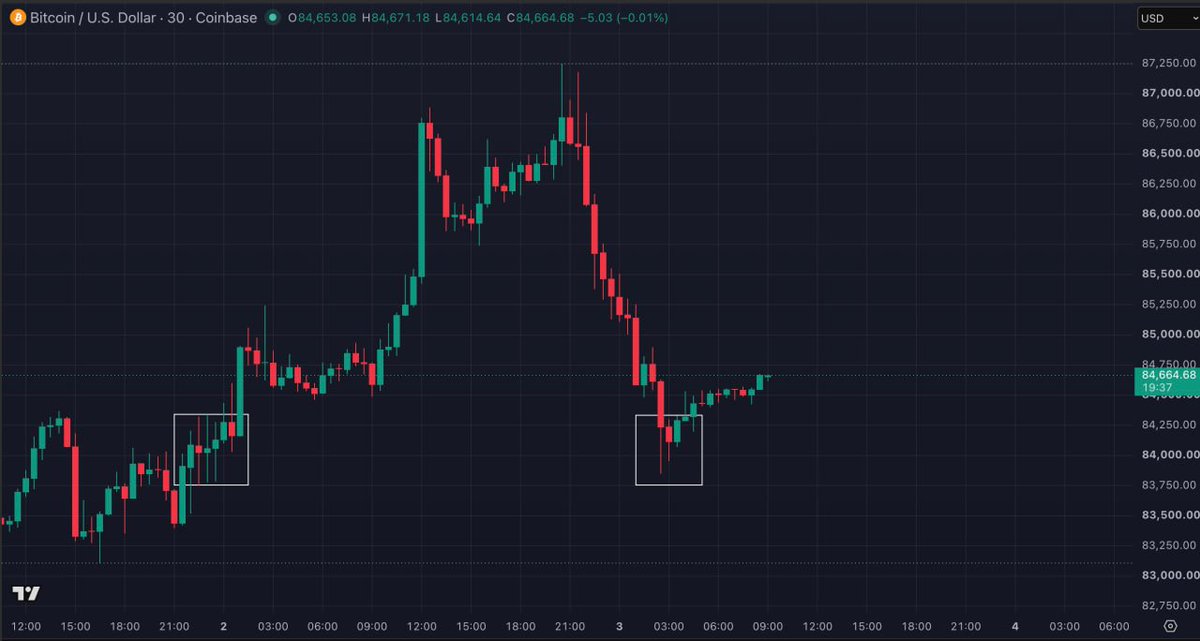
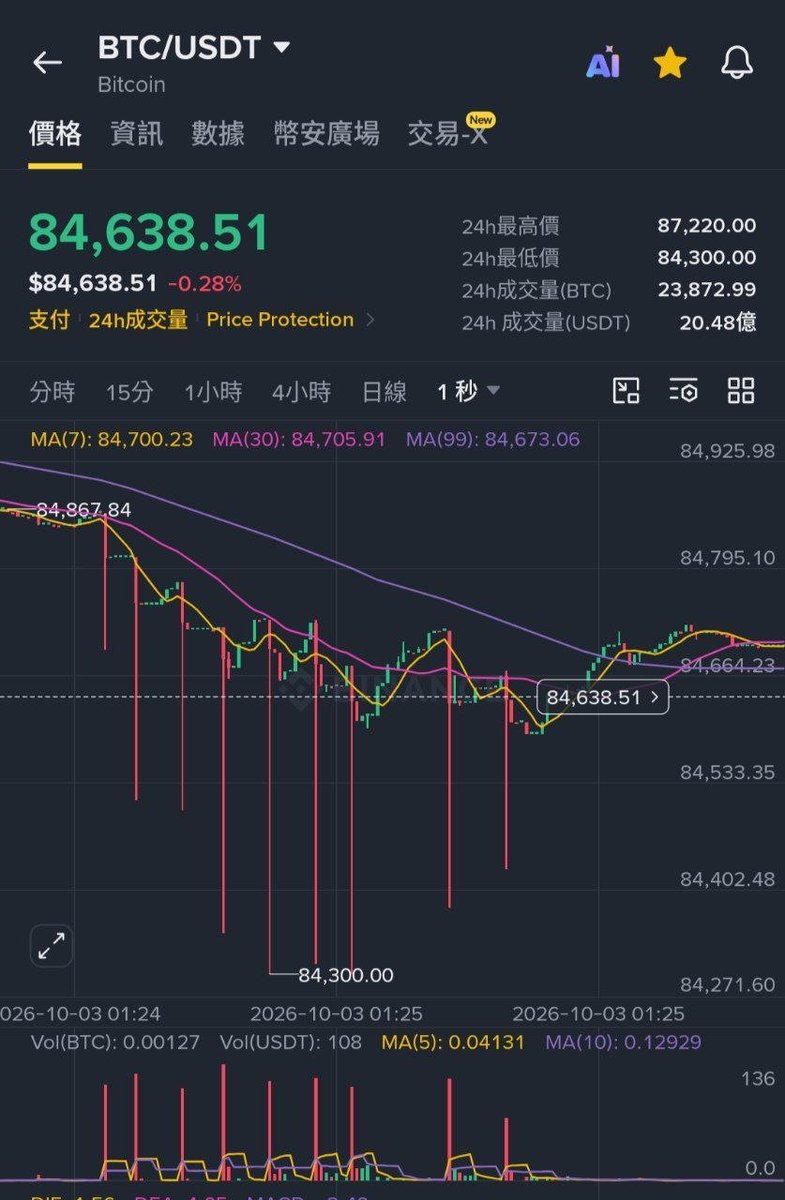
Sharing Murphy's post here and adding an observation I’ve noticed over the past few days. The left white box shows around 11 PM on 10/1. At that time, U.S. stocks and gold were weakening, but on Binance’s BTC/USDT spot market, someone went against the trend and placed consecutive market buy orders totaling about 400 BTC, forcing the price to hold above 84K. The final candlestick closed as a doji. The right white box shows around 1:30 AM on 10/3. In the same price range, about 1,400 BTC in market sell orders suddenly flooded in within a short period, causing the price to drop sharply and leaving a long lower shadow. However, the price still managed to hold its ground in the end. The second image shows second-level candlesticks. Every few seconds, there were 100 BTC sell-offs, but after each candlestick was pushed down, buy orders quickly pulled it back up. This price level also happens to overlap significantly with the 83–84K range where on-chain accumulation has been rapidly increasing recently. Looking at data from these two different dimensions, the situation is very consistent: Around 83–84K, there’s capital actively absorbing. Whenever the price enters this range, the buying response is very noticeable.