7 x 24 快訊
更多 >今天 2025-09-25
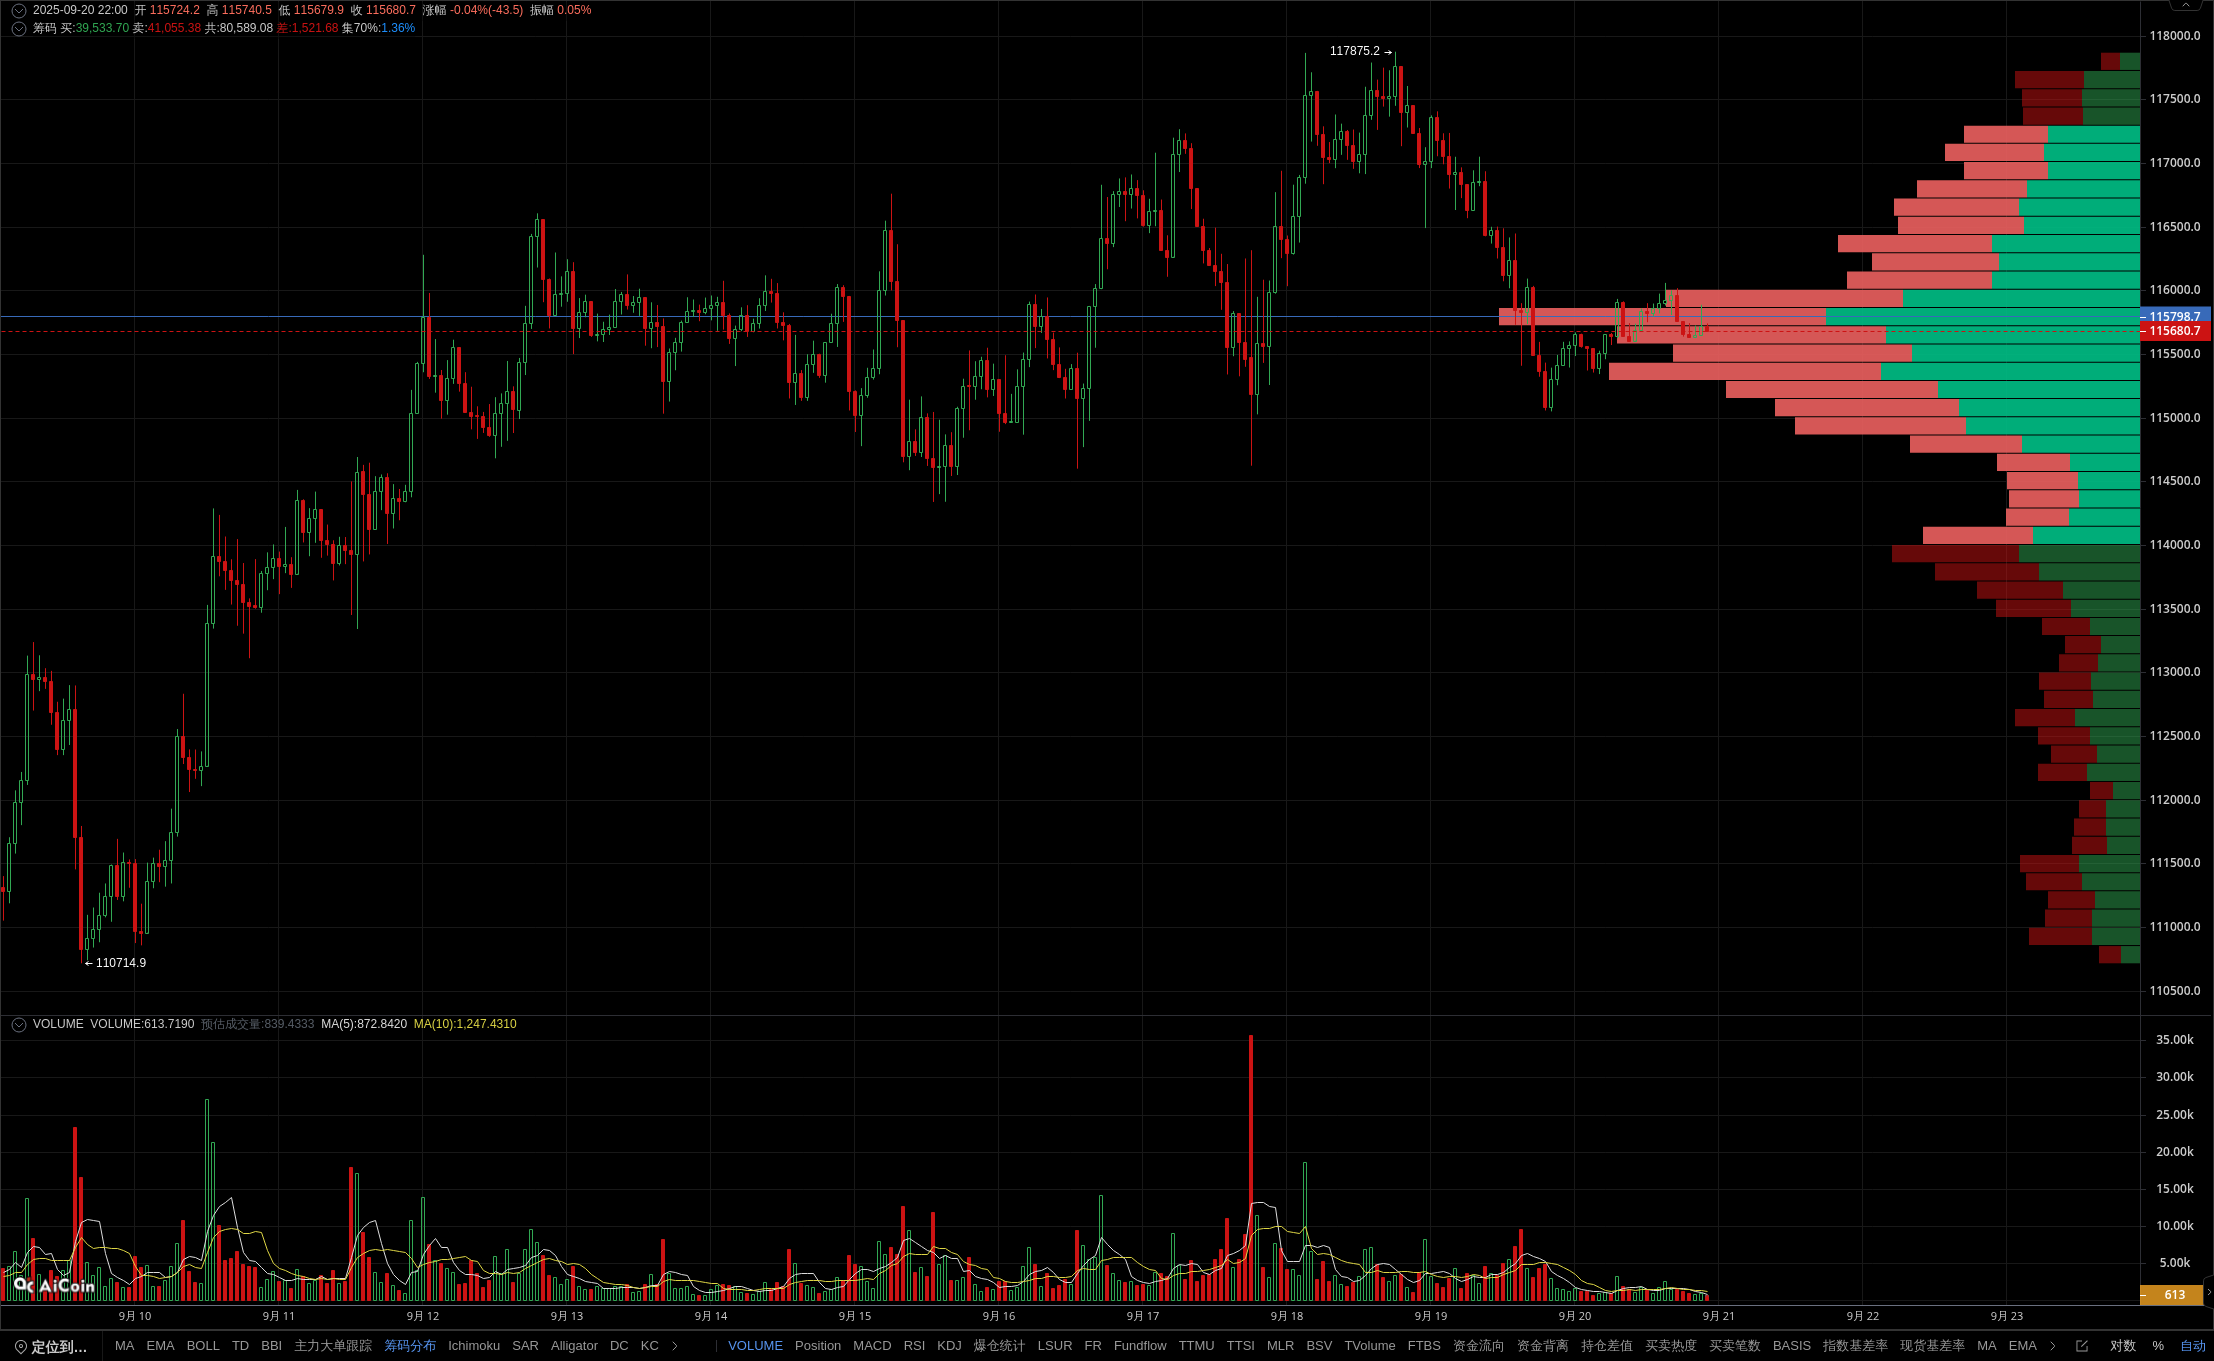
The current membership indicators show that BTC's trading volume continues to shrink in the 1-hour cycle, with short and medium-term averages showing a bearish trend, indicating that market selling pressure is gradually increasing. At the same time, the price is below the EMA24 and EMA52 moving averages, confirming the weakness of the overall trend. The distribution of chips indicates that 115558 and 115418 form a strong support zone, but the current price is approaching this range. If it falls below, it may quickly drop to 115277.5. The MACD bar chart has weakened momentum, and although KDJ is in oversold territory, the rebound strength is yet to be confirmed. Although the flat bottomed shape suggests support, it is suppressed by the top split, indicating fierce competition between long and short positions. Activate membership immediately and accurately capture changes in support levels and energy levels! The data is sourced from the PRO member's [BTC/USDT Binance USDT perpetual 1-hour] candlestick, for reference only, and does not constitute any investment advice.