Loading...
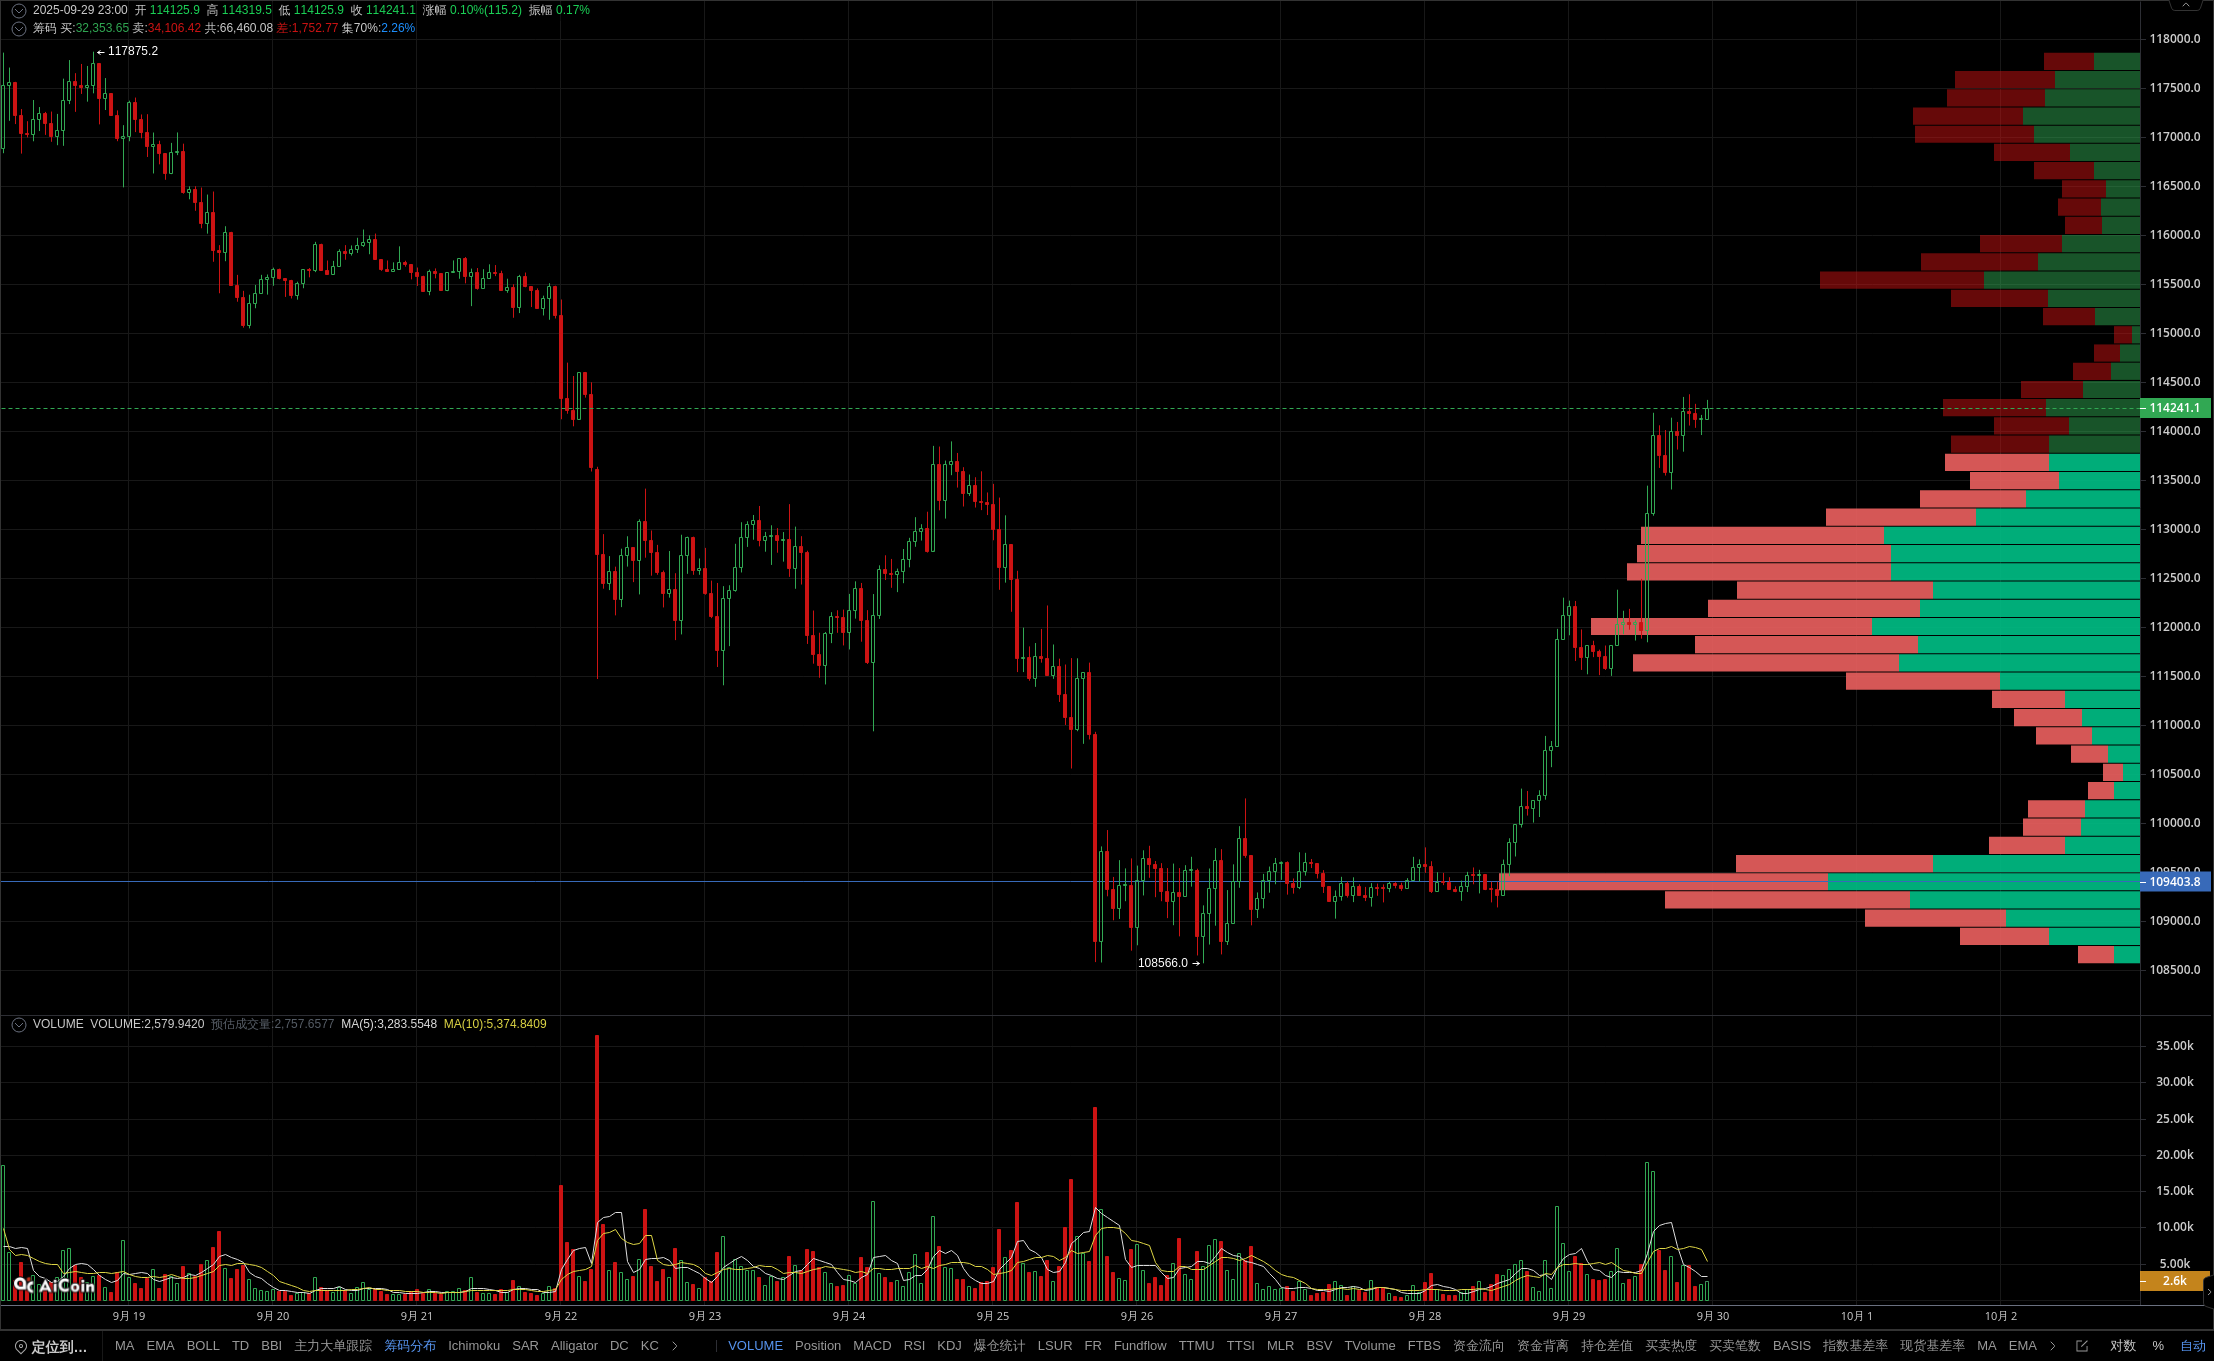
BTC short-term volatility intensifies: key support levels may become a long short watershed
--
Member indicators show that the current price is above the strong support of 109361.5, but trading volume has shrunk to an average of 48.49%, indicating a decrease in market interest and suggesting insufficient bullish momentum. At the same time, KDJ is overbought and the MACD bar chart continues to decrease, with increased downward momentum and a combination of technical bearish signals. The chip distribution shows that 109273-109450 is the area with the highest trading volume density. If it falls below this range, it may quickly explore the LVN area. EMA24/52 is still in a bullish position, but the risk of RSI overbought and falling back is increasing. Pay attention to the gains and losses of 109361.5 support. Unlock the membership function and accurately capture changes in chip distribution and main trends! The data is sourced from the PRO member's [BTC/USDT Binance USDT perpetual 1-hour] candlestick, for reference only, and does not constitute any investment advice.