7 x 24 快訊
更多 >今天 2025-10-15
13:30
13:20
13:19
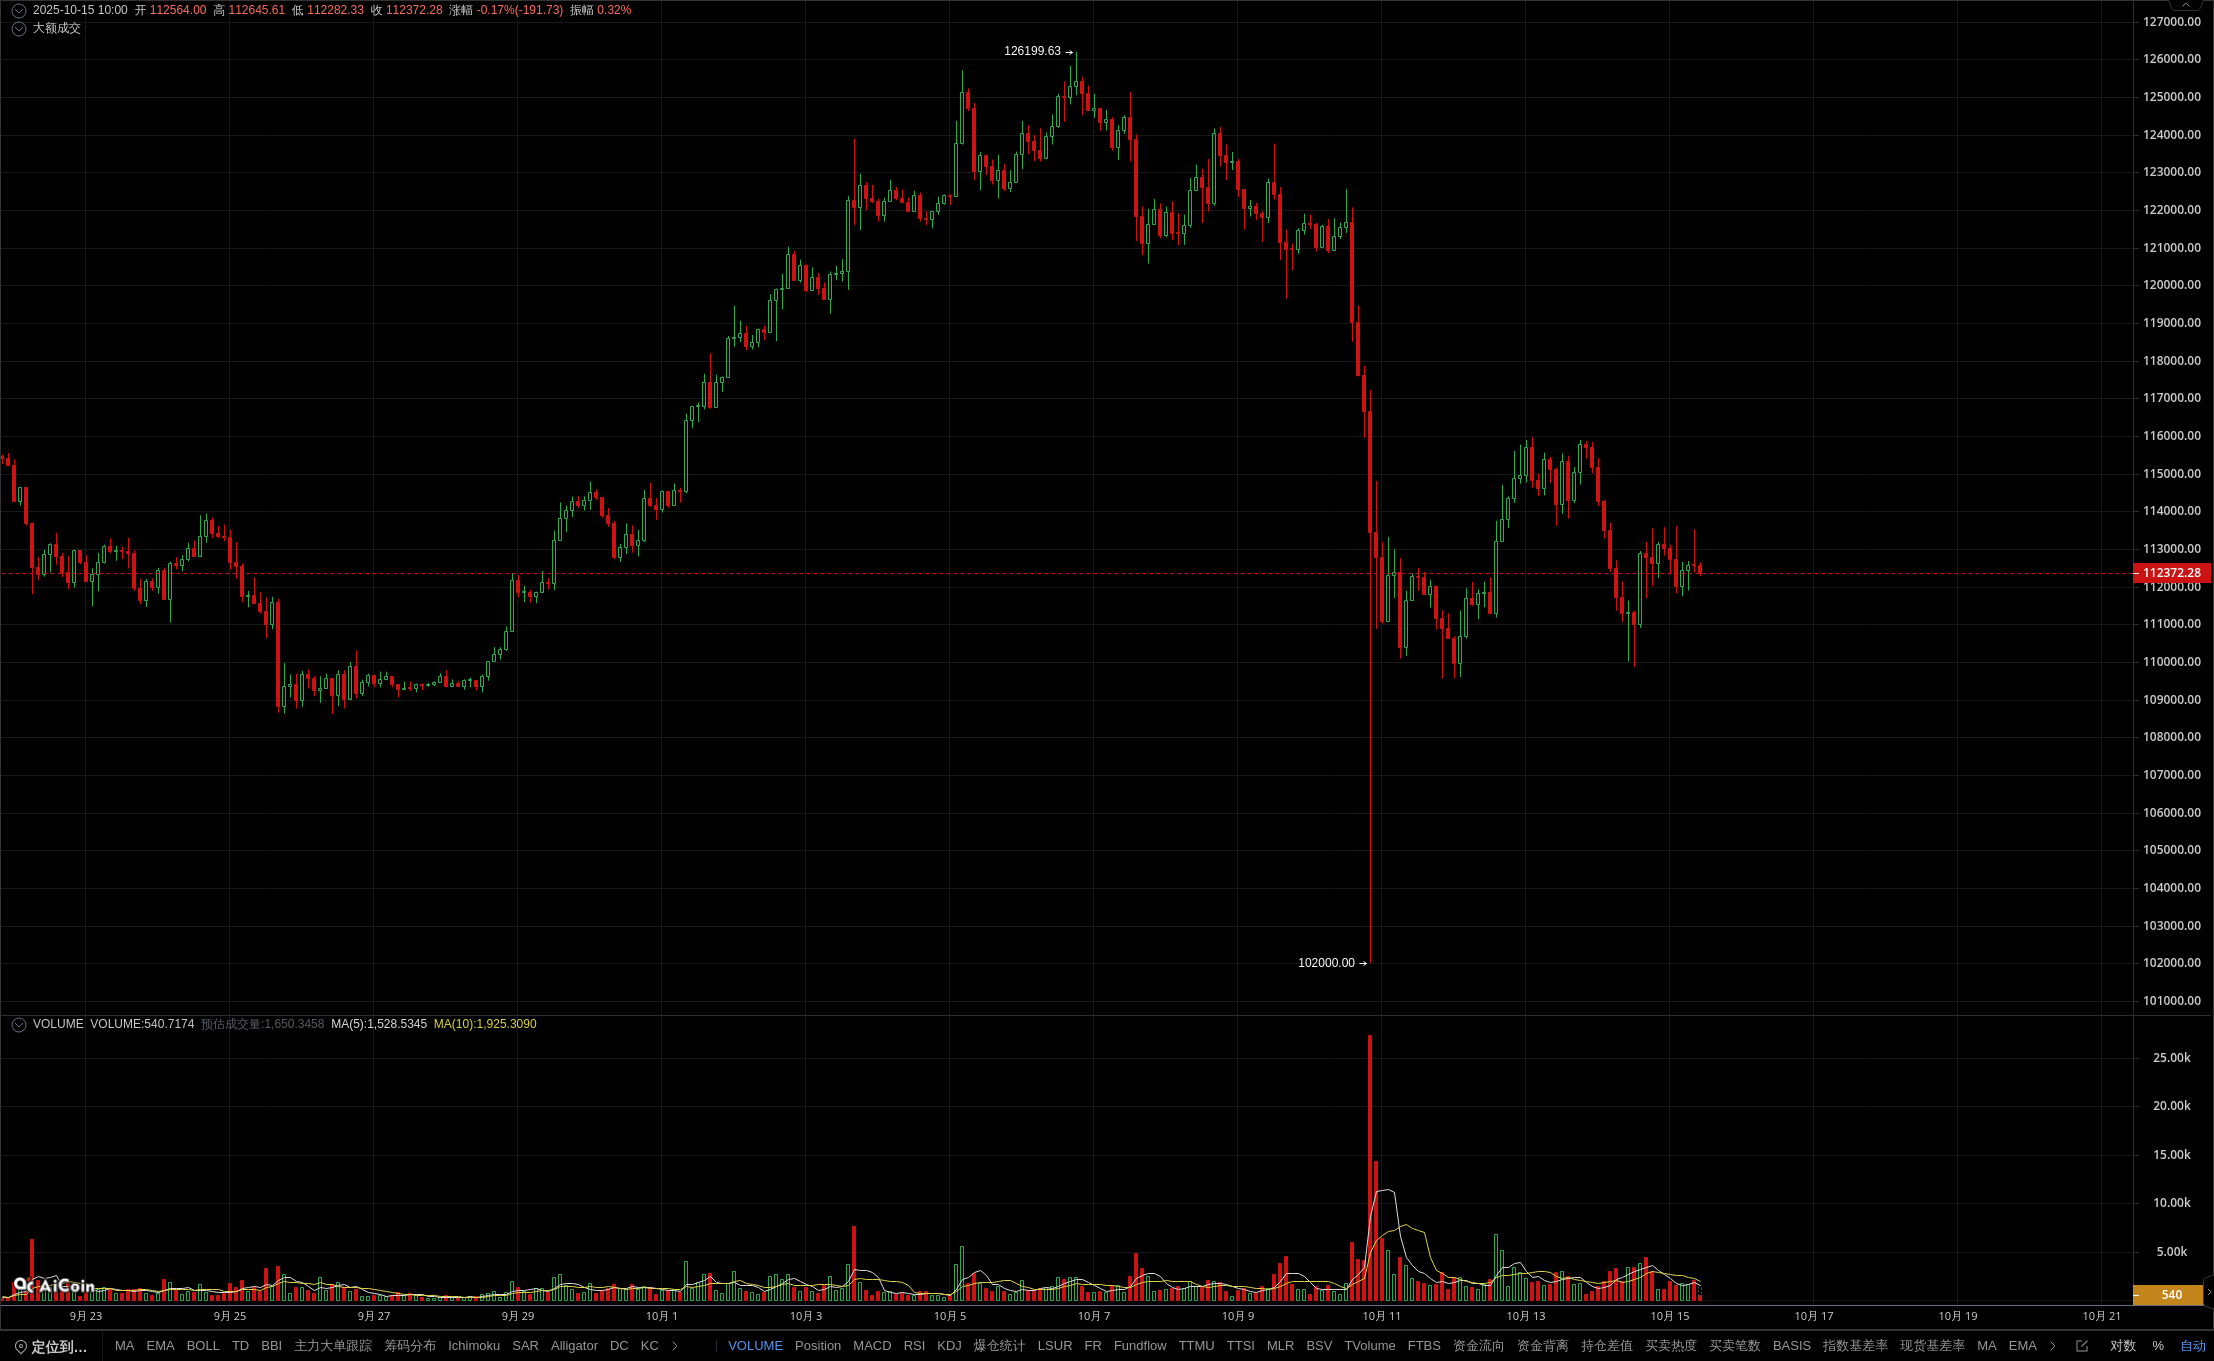
The K-line of the past 2-hour cycle shows that BTC prices have continued to operate below the EMA24 and EMA52 moving averages, showing an overall weak downward trend. At the same time, the K-line pattern continued to show a top pattern and an upper hanging line, strengthening the short-term bearish signal. However, the current market lacks large transaction data, and the movement of main funds is still unclear. If the abnormal movements of large market buy or sell orders can be monitored in a timely manner, key signals of trend reversal can be captured in advance. Combining the dead cross below the MACD zero axis with the divergence downward trend of the KDJ indicator, BTC's downward momentum is still being released, but caution should be exercised against sudden actions by the main force to attract or smash the market. Open membership, track major large transactions, and accurately grasp market turning points! The data is sourced from the PRO member's [BTC/USDT Binance 2-hour] candlestick, for reference only, and does not constitute any investment advice.