The more it sells, the higher it rises. Who is receiving the goods behind MU?
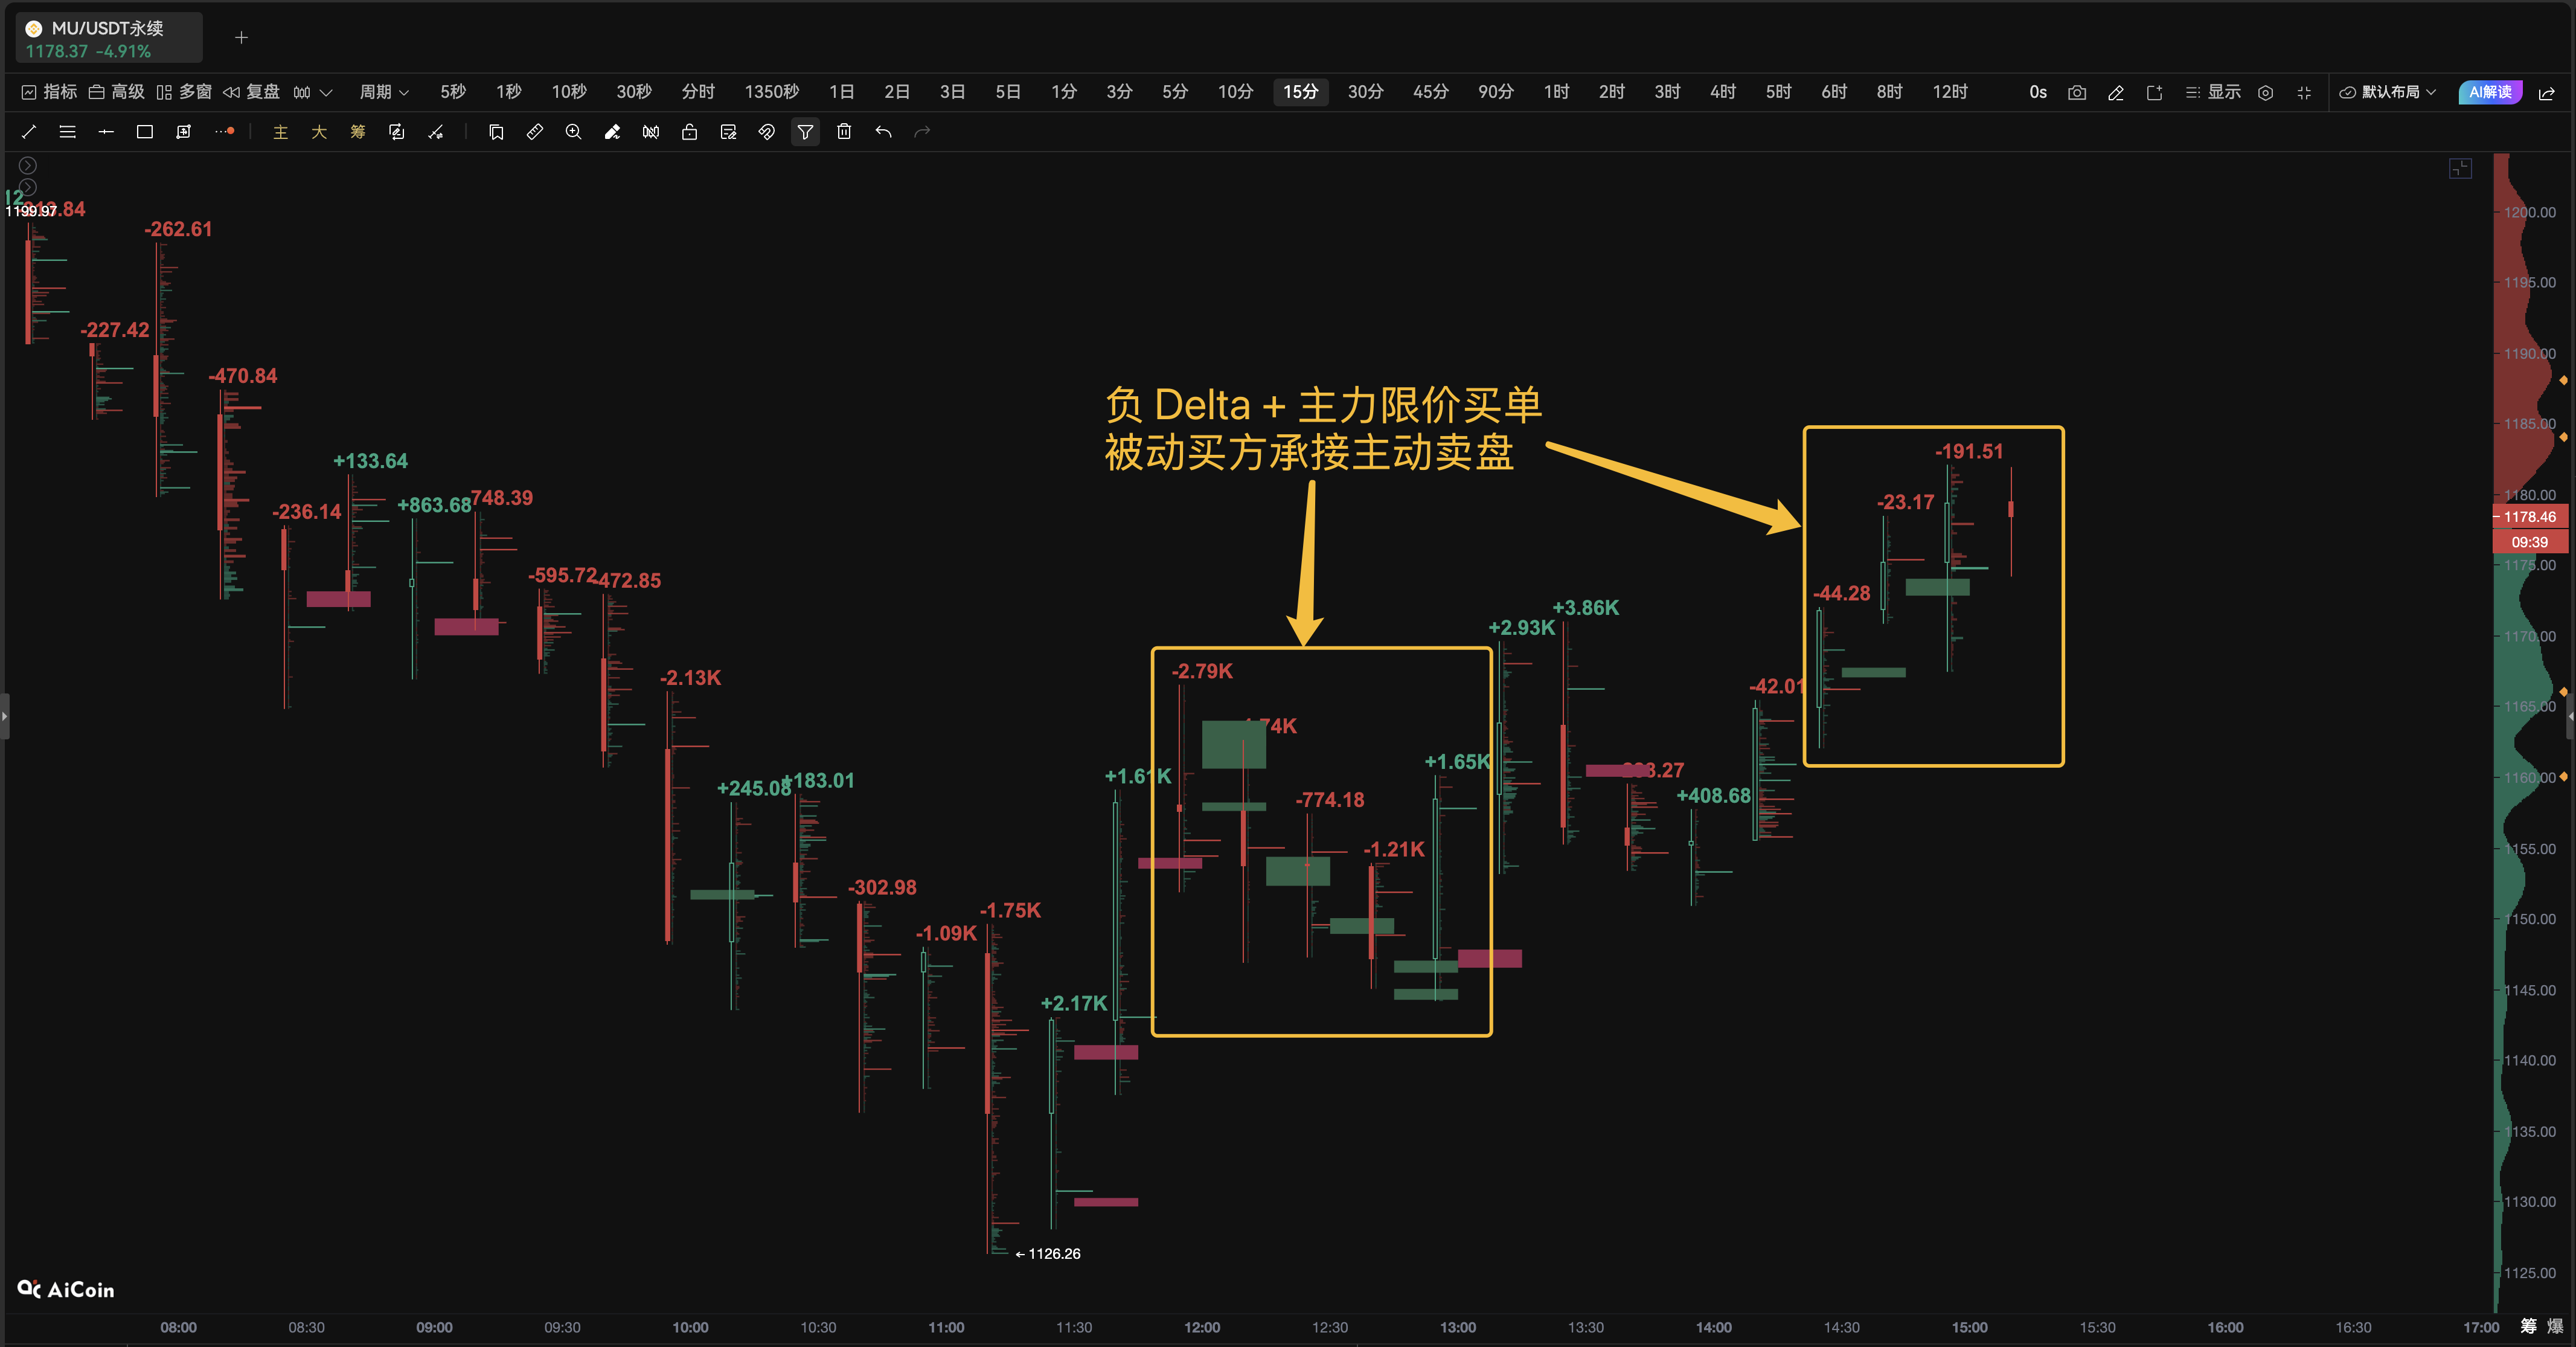
The 15 minute "footprint chart" shows that during the rebound process of MU, multiple candlesticks showed negative Delta, and active selling continued to dominate, but the price did not fall, but instead continued to rise. Combining with PRO's "Main Large Order Tracking", it was found that there were over 10.5 million US dollars of limit buy orders in two key areas during the trading session. Among them, from 12:05 to 13:05, the main force received a selling order of 8.916 million US dollars, and from 14:35 to 14:55, it received another selling order of 1.597 million US dollars. This means that there are people selling on the surface of the market, but there is a larger amount of capital below that continues to receive goods, and the selling pressure is constantly being digested. For traders, price increases are not uncommon, what is truly valuable is seeing who is driving the rise. Through the PRO "Footprint Chart" and "Main Order Tracking", not only can transactions be seen, but also it can be determined whether the main force is receiving, shipping, or luring short positions, and understand market changes from a financial perspective. Next, we can focus on whether to continue holding the buying orders and whether the selling pressure above can be further digested.