Loading...
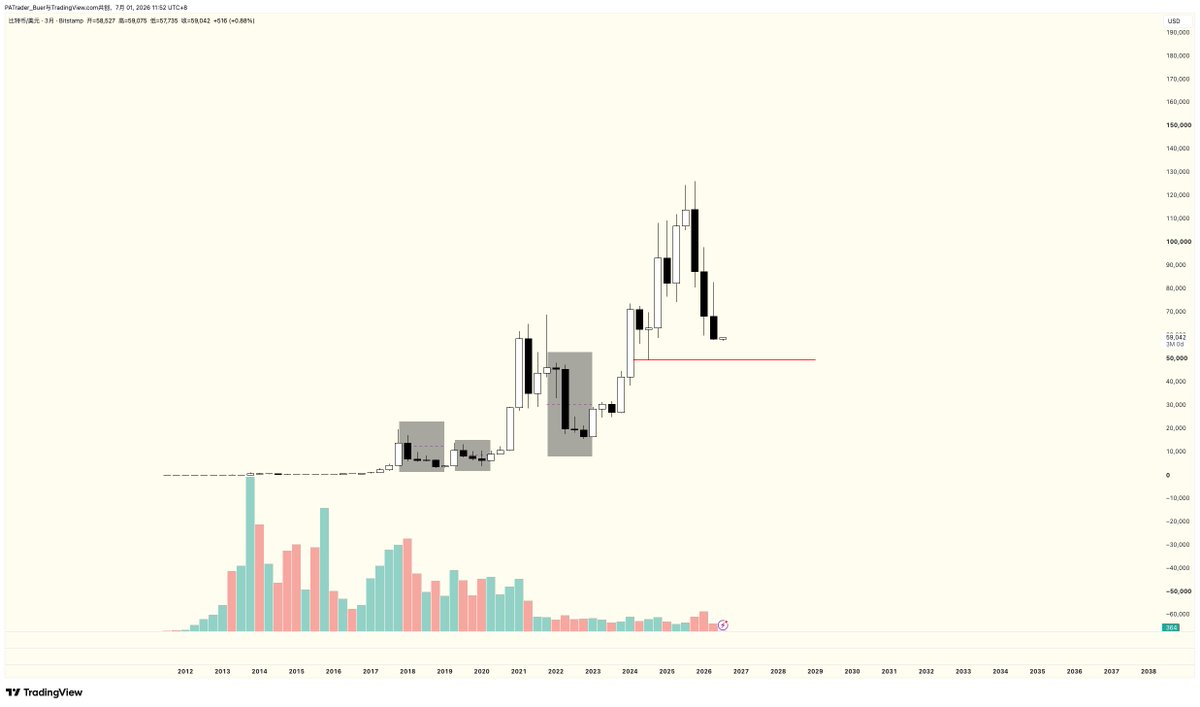
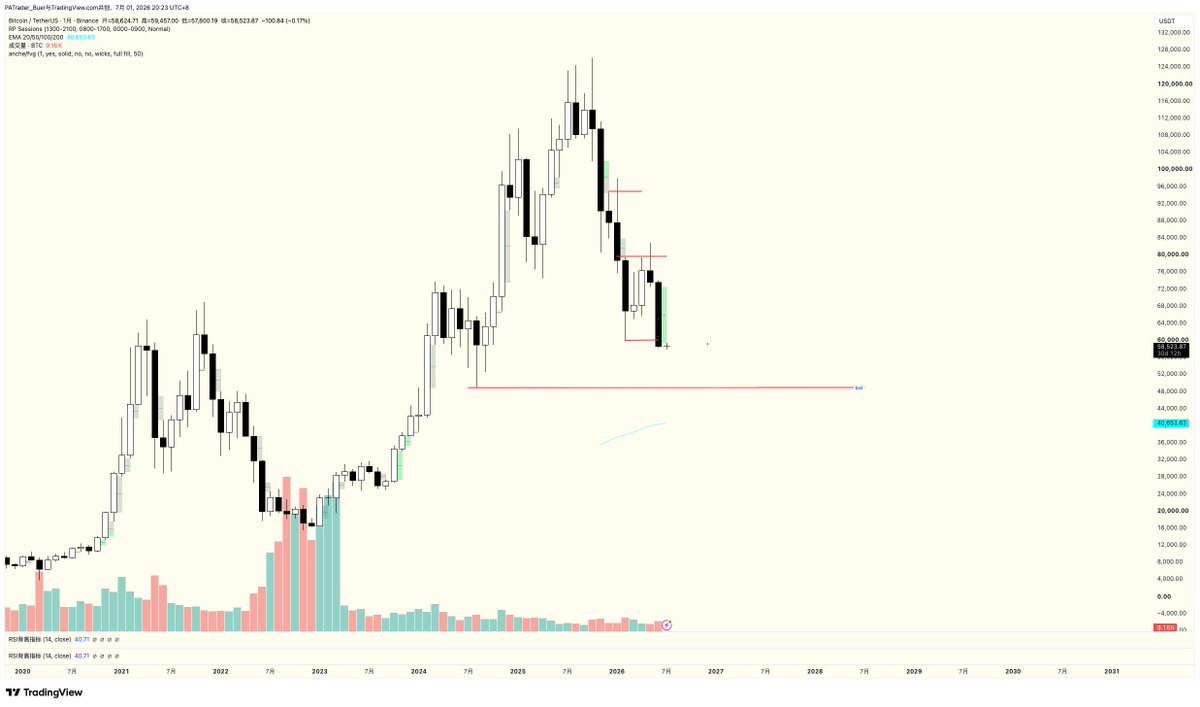
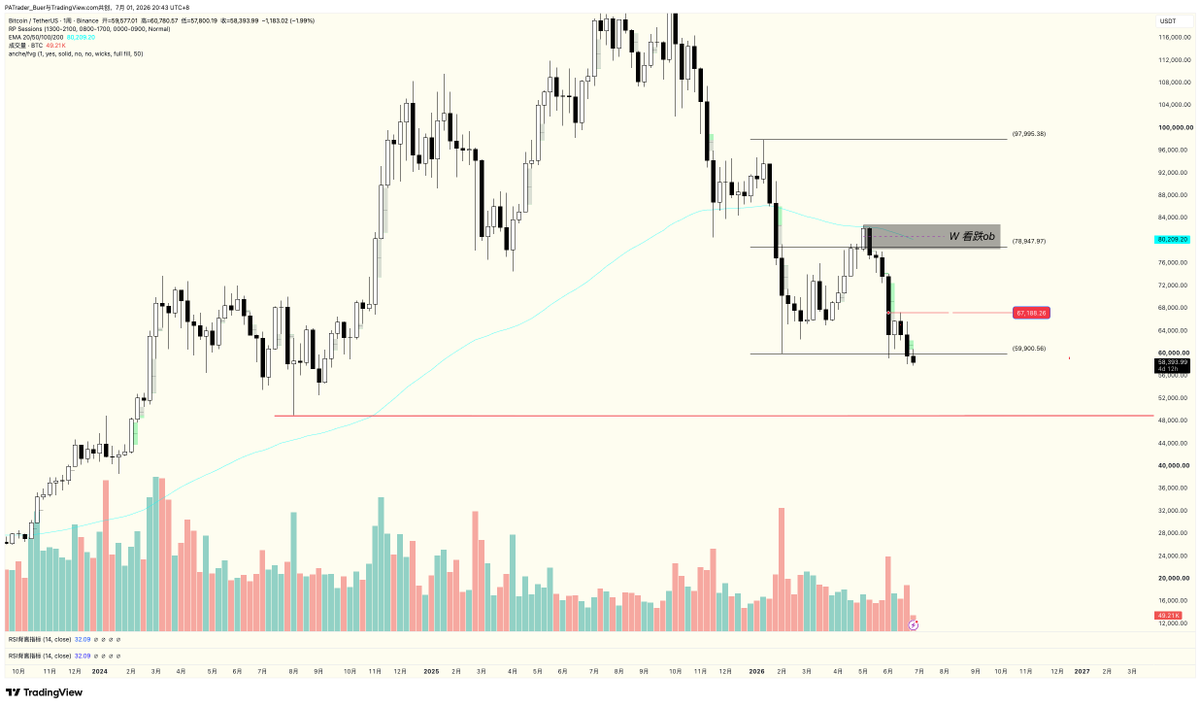
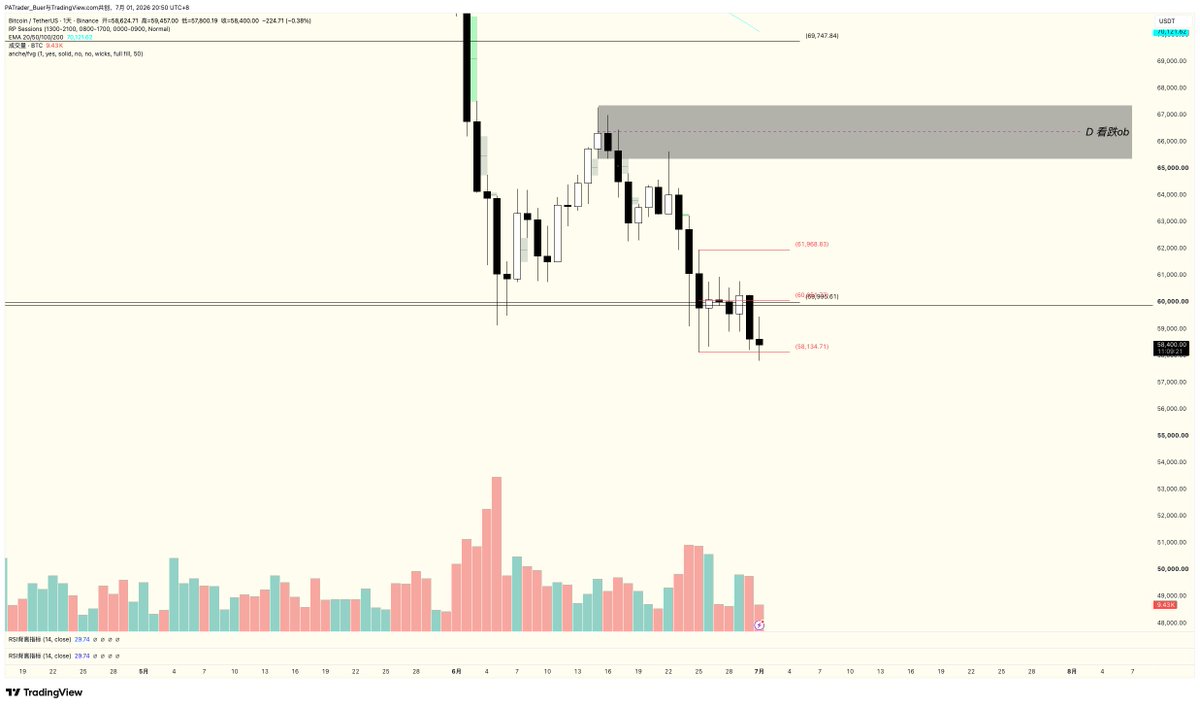
Parbitcoin: Native Market Monthly Report -7.1 Figure 1: Quarterly Chart 1) The quarter has already experienced three consecutive declines, with two four consecutive declines and one three consecutive decline in history, all of which have bottomed out. According to history, this quarter is basically the bottom. From a liquidity perspective, the most we can do here is to plunder 49% of the BSL liquidity. 2) So the third quarter is a bottoming out quarter. The main impact in the second half of the year is currently the midterm elections, which will run from late September to November 3, 2026. According to this timeline, I think September/October will be a low time. 3) Everyone can refer to this time to make a fixed investment layout first. Figure 2: Monthly chart 1) The monthly report for June showed a decline, falling below 6W. It can be seen here that 6W has been plundered, and the current June monthly closing line is 586. A few days ago, the weekly report stated that the weekly and monthly lines closed below 6W. However, currently speaking, it is still biased downwards because it does not represent plundering and will continue to decline. 2) Where is the bottom? I don't know. Currently, my inferred position is still strong at 54, normal at 47, and extreme at 38. Or rather, I prefer to gradually build a warehouse between 54-45. 38 hanging orders to prevent extreme situations. 3) This month's key events focus on: one ⃣ 7/1: Fed Chair Warsh ECB Forum Speech two ⃣ 7/2: Non farm NFP (June) three ⃣ 7/8: FOMC Meeting Minutes four ⃣ 7/13: Financial reporting season begins (7/13-7/17) five ⃣ 7/14: CPI inflation (June)+ED semi annual monetary policy report (House of Representatives) six ⃣ 7/15: PPI (June) seven ⃣ 7/29: FOMC interest rate decision (02:00 ET)+Warsh press conference (02:30 ET) The focus this month remains on the geopolitical situation between the United States and Iran, as well as whether to raise interest rates. At present, the geopolitical situation between the United States and Iran is approaching a plateau, so it is better to focus on oil prices. The price of oil is more directly related to whether the Federal Reserve will loosen its grip. -Multi head logic: cooling employment → slowing consumption → Fed stops hawkishness → favorable risk assets -Short logic: CPI still at 4%+, PPI at 6.5% → inflation stickiness → Fed forced to raise interest rates → valuation double kill -AI variable: If tech giant Q2 financial report falls short of expectations, "AI faith" will face profit verification and high-level differentiation will intensify. So every news this month is an expectation for the FOMC interest rate meeting on the 29th. Figure 3: Weekly Chart 1) Zhou K is currently receiving below 6W and has been rejected by 6W range-l. Therefore, for now, we should continue to look downwards. I will first look around 54 below. 2) The rebound here requires at least a stable 6W before we can see the test against 673. So, if you are a right-handed trader, you can choose to hold steady at 6w or buy when the daily chart shows features such as MSB. Left side traders and fixed traders pay attention to the slow buying machine under 60000. Yes, make a buying plan. 3) Tonight: 21:30 Warsh, ECB President Lagarde, BOE President Bailey on stage. Note: Any statement by Warsh regarding "inflation resilience" or "the necessity of interest rate hikes" will be amplified by the market. June Non farm payroll report for the United States at 20:30 on the 2nd. Game point: Weaker than expected → Cooling of interest rate hike expectations → Positive news for risk assets; Stronger than expected → The probability of interest rate hikes in September has rebounded → The entire line is under pressure. The current market's bet on a September interest rate hike has cooled down due to the decline in oil prices, and non farm payroll is a secondary confirmation window. 3rd, Friday Independence Day holiday. Figure 4: Daily chart 1) The daily chart is still in a downward trend, and today it has plundered 58. At present, let's take a look at the reaction at position 58 and see if tomorrow's daily chart can close above 58. If possible, there will be a slight rebound and increase tomorrow. If it closes below 58, then pay attention to continuing the decline. 2) If it can be closed above 58, then let's first look at the 6W test. 6W refuses to continue down, and 61 breaks through. With the daily MSB, we can expect further rebound. PS: Currently, it is a period of multiple news and fluctuating fluctuations. And now it has entered the stage of retail investors guessing low. When retail investors guess low, it is uncertain whether it is low. Moreover, in terms of trend, going long is still against the trend, but going short does not have a clear bottom. My suggestion for this stage is: Retail contract traders: Reduce positions, be cautious in volatility, and close when there is a good opportunity. Long term investment without time: Start gradually in the 60000 to 50000 stage, increase the amount in the 50000 to 40000 stage, and make good expectations and fund allocation.