Loading...
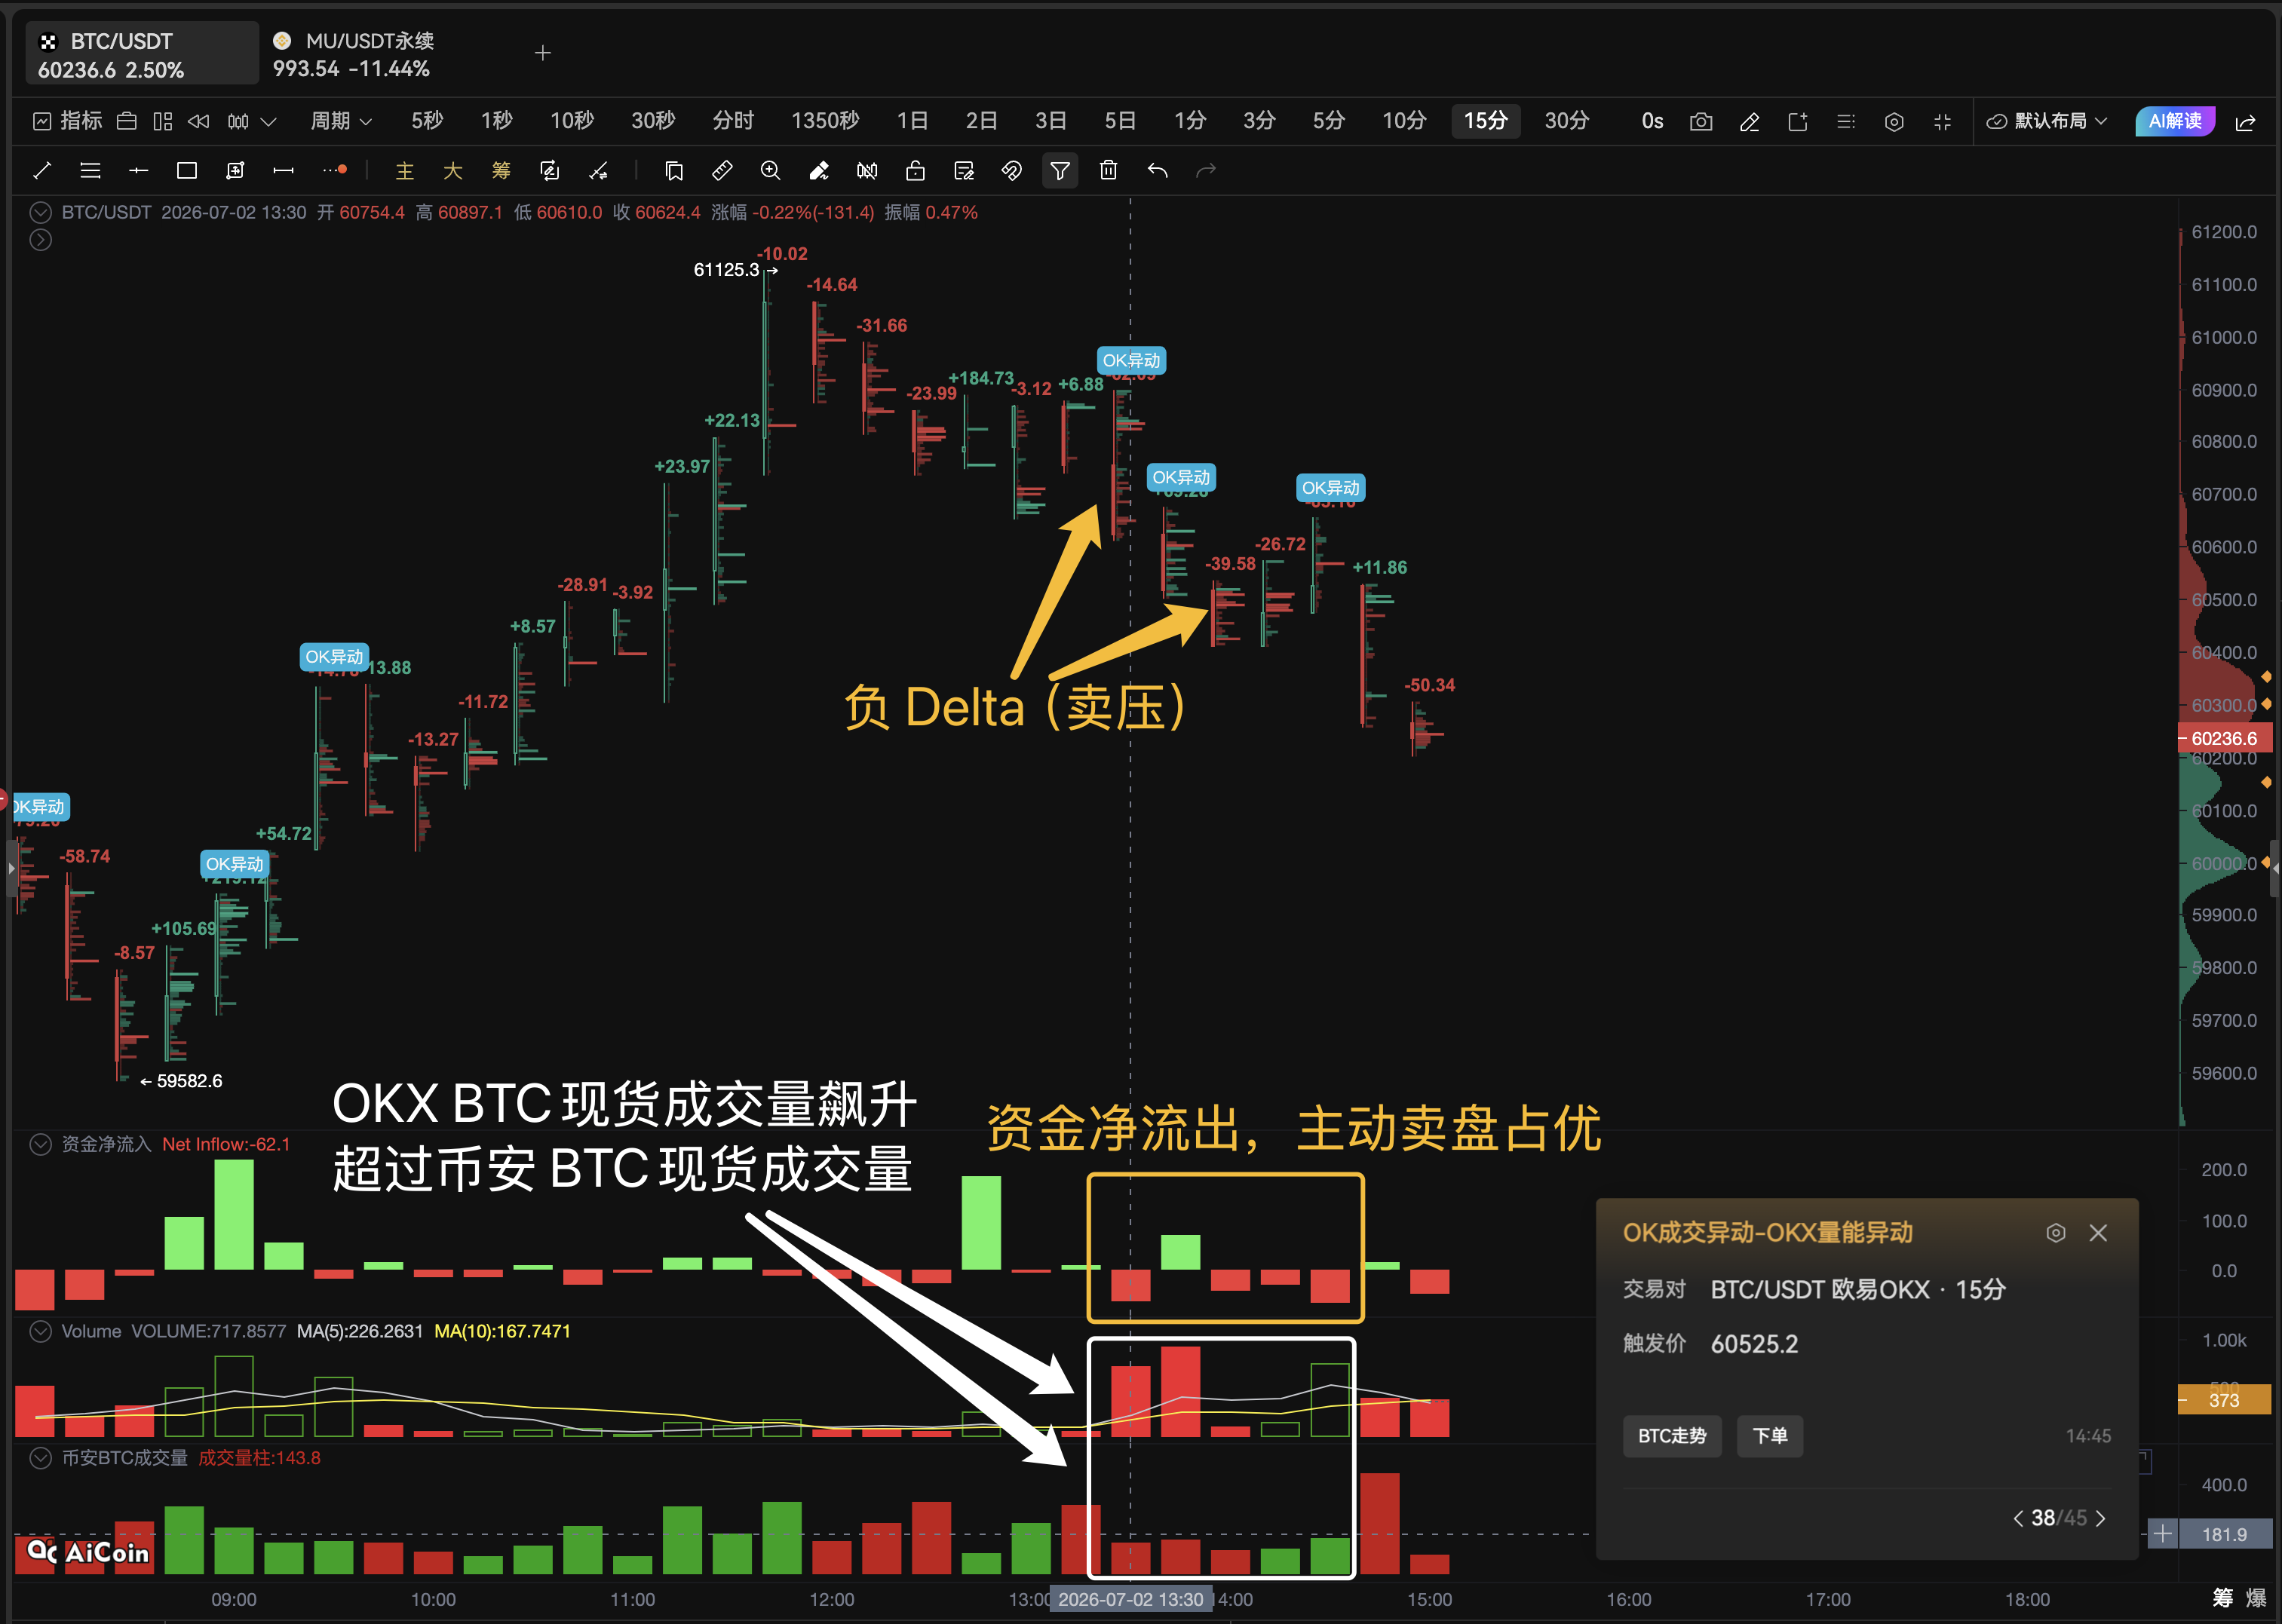
According to AiCoin monitoring, since 13:30, the spot trading volume of OKX BTC/USDT has significantly surged, once exceeding the spot trading volume of Binance BTC, indicating that there has been a fund movement in the OKX market. Based on the PRO "Footprint Chart", it was found that multiple candlesticks were negative Delta during this period, and active funds also turned into net outflows, indicating that the current selling market is dominant and the active buying market is not strong enough, resulting in a price drop. Next, we can focus on the support of the EMA31 and EMA21 moving averages with a 45 minute custom cycle. If this area cannot be held, it indicates that selling pressure may continue to be released; If it can stabilize, there is a chance to re observe the buying reception, and the resistance zone above remains unchanged (as reminded in the PRO group). The value of a footprint chart: Ordinary candlesticks only see an increase in trading volume, but PRO can see whether this wave of volume is driven by buying or selling pressure. Open PRO and use the 'Footprint Map' to identify active buying and selling forces, no longer mistaking high volume for a breakthrough. The data is for reference only and does not constitute any investment advice.