Loading...
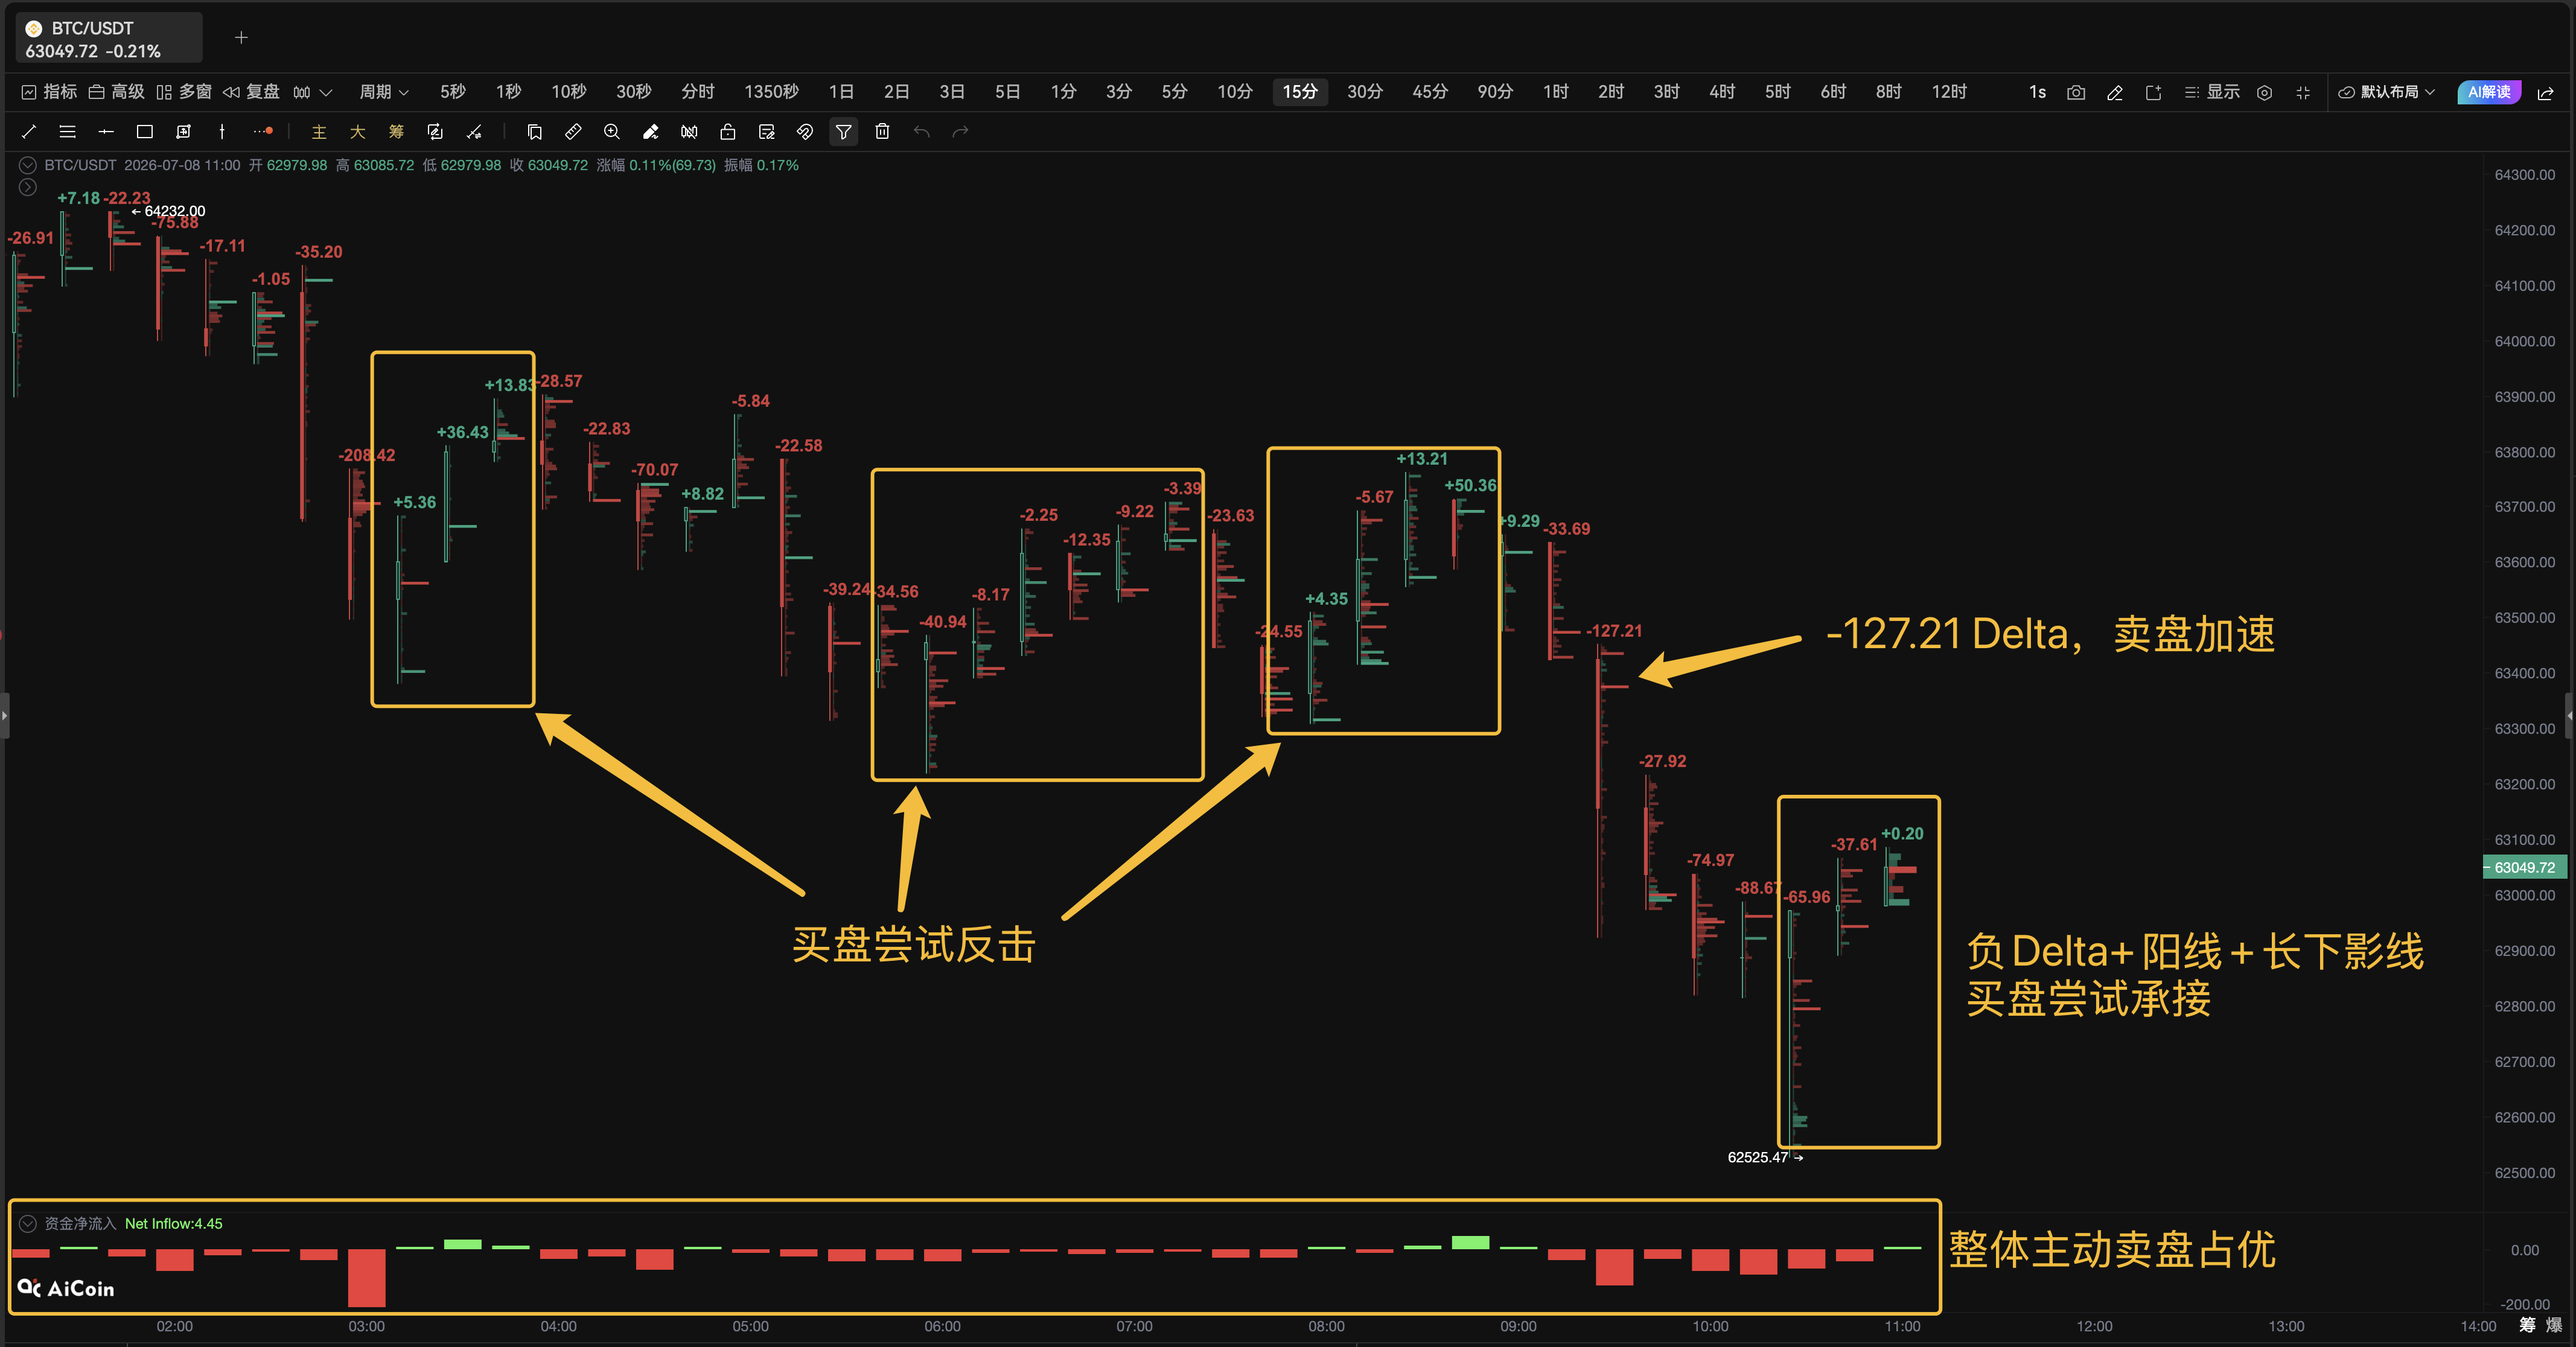
The PRO "Footprint Chart" shows that after BTC actively sells and releases, initial consolidation begins at low levels. Starting this morning, BTC prices have been continuously declining, with multiple candlesticks showing negative Delta values, and active selling continues to dominate. Especially at 09:30, the -127.21 Delta, accompanied by a rapid price drop, is a typical selling acceleration signal. Subsequently, BTC showed a bullish candlestick, a long bearish candlestick, and a negative Delta around $62525, indicating that there was buying activity attempting to take over at a low level. But compared to the previous consecutive negative Delta, the buying momentum is insufficient, and it can only be considered as an attempt to stop the decline for the time being. At present, the overall active selling has not completely withdrawn, and the next focus is on whether Delta continues to turn positive and amplify, that is, whether the active buying can successfully counterattack. If it cannot be achieved, the low-level takeover is likely to only be a temporary repair, and selling may still continue to dominate. The value of a PRO footprint chart lies in this: a regular candlestick chart only sees a rebound after a drop, but a footprint chart can show whether there is real active buying following this rebound. Open PRO and use a footprint chart to see the active buying and selling power, don't mistake the attempt to stop the decline for a reversal. The data is for reference only and does not constitute any investment advice.