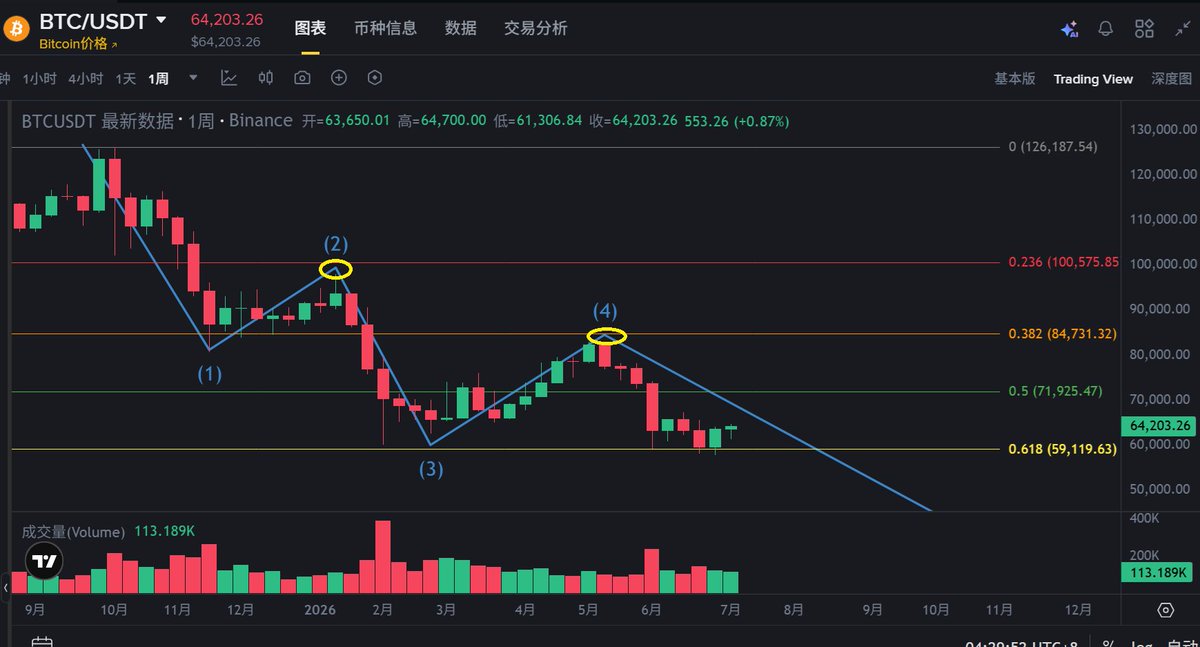
Brothers and sisters, I took a look at Bitcoin's weekly candlestick pattern this week and compared it to the rebound highs of Wave 2 and Wave 4 in the past. Using $126,800 as the 0 axis and $15,600 as the 1 axis for Fibonacci retracement, the rebound high of Wave 2 happened to fall near the 0.236 Fibonacci retracement level, and the rebound high of Wave 4 also happened to fall near the 0.618 Fibonacci retracement level. So, for this rebound rally that started at $58,000, is it possible that the high point of this rally could be around $72,000, near the 0.5 Fibonacci retracement level? Previously, I predicted the extreme high point of the rebound to be around $68,000. A rebound high of $72,000 is also possible, but the probability is very low. I’ll do a deeper analysis and prediction later. Check out the chart below :