Loading...
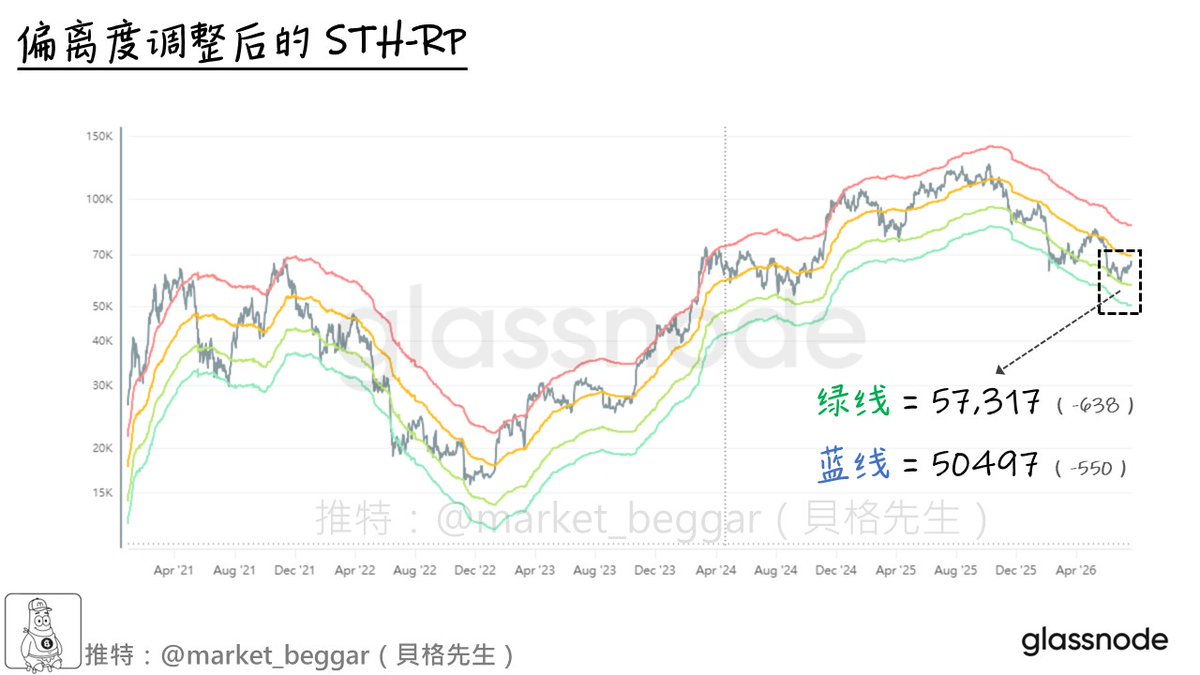
Deviation adjustment STH-RP model update: slowing down and gradually clarifying the bottom range Continuing the quote below, after two weeks, let's talk about the latest data of this model today. In the previous analysis, I proposed another potential 'bottoming possibility', That is to say, the green line gradually moves downwards, replacing the blue line and forming resonance with other deep bear model bottom fishing areas. Now, in the past two weeks, there have been some noteworthy signs: // The indicator in the attached figure is' STH-RP with deviation adjustment ', and the concept is reviewed as follows: ➡️ Calculate the mean and standard deviation of STH-MVRV since 2018 ➡️ Multiply STH-RP by the mean ± n standard deviations of STH-MVRV ➡️ The reason for using data after 2018 as the calculation benchmark is that, The reason is that STH-MVRV after 2018 exhibits significant mean regression characteristics. Red line=STH-RP multiplied by the mean of STH-MVRV plus 1 standard deviation Yellow line=STH-RP Green line=STH-RP multiplied by "Mean of STH-MVRV -1 standard deviation" Blue line=STH-RP multiplied by 'Mean of STH-MVRV -1.5 standard deviations' Detailed review of the bottoming time supported by the blue line: https://((((((x.com))))))/market_beggar/status/2026474493749989766 Analysis of all historical cases supported by the blue line: https://((((((x.com))))))/market_beggar/status/2018501752103047340 // As shown in the attached figure, the latest data of the current model is as follows: Green Line: 57317 (638 points lower than last update) Blue line: 50497 (decreased by 550 points compared to the last update) As far as the current model data is concerned, the script I mentioned earlier in the following quote still applies, That is to say, the position of the green line and 'Path 2' perfectly complement each other, forming resonance, Friends interested in learning more about this foundation script can refer to the following citation and link : Path deduction of BTC's' three periodic bottom structures' https://((((((x.com))))))/market_beggar/status/2075529216591053204 In addition, there is actually a small detail worth noting in the past two weeks: As BTC recently enters a phase of 'fluctuating and slowly rising', The descent speed of the blue and green lines has slowed down since 07/13, The values of the blue and green lines show almost no change (flattening). If the blue and green lines continue to decline and even show signs of turning upwards, Perhaps it indicates that the end of the bear market is quietly approaching; And if there is a large-scale rapid downward insertion of BTC in the future and it steps on the green line, It is highly possible to complete a final bottoming process without significantly affecting the model values. Finally, based on my evaluation of all the analysis posts in the past two months, my judgment remains unchanged: We are currently at a time point very close to the cyclical bottom of BTC Maintain patience and wait patiently for the flowers to bloom. The above is today's content, hoping to be helpful to everyone // Related reading resources The White Heat of Battle: The Key Liquidity Region of Stacked STH-RP https://((((((x.com))))))/market_beggar/status/2080106688917754256 Latest data update on two 'deep bear bargain hunting market cost lines' https://((((((x.com))))))/market_beggar/status/2079745937350779015 BTC Crowdfunding Trend Score Update: Continuous Monitoring of Distribution Risks https://((((((x.com))))))/market_beggar/status/2079383301299851536