Loading...
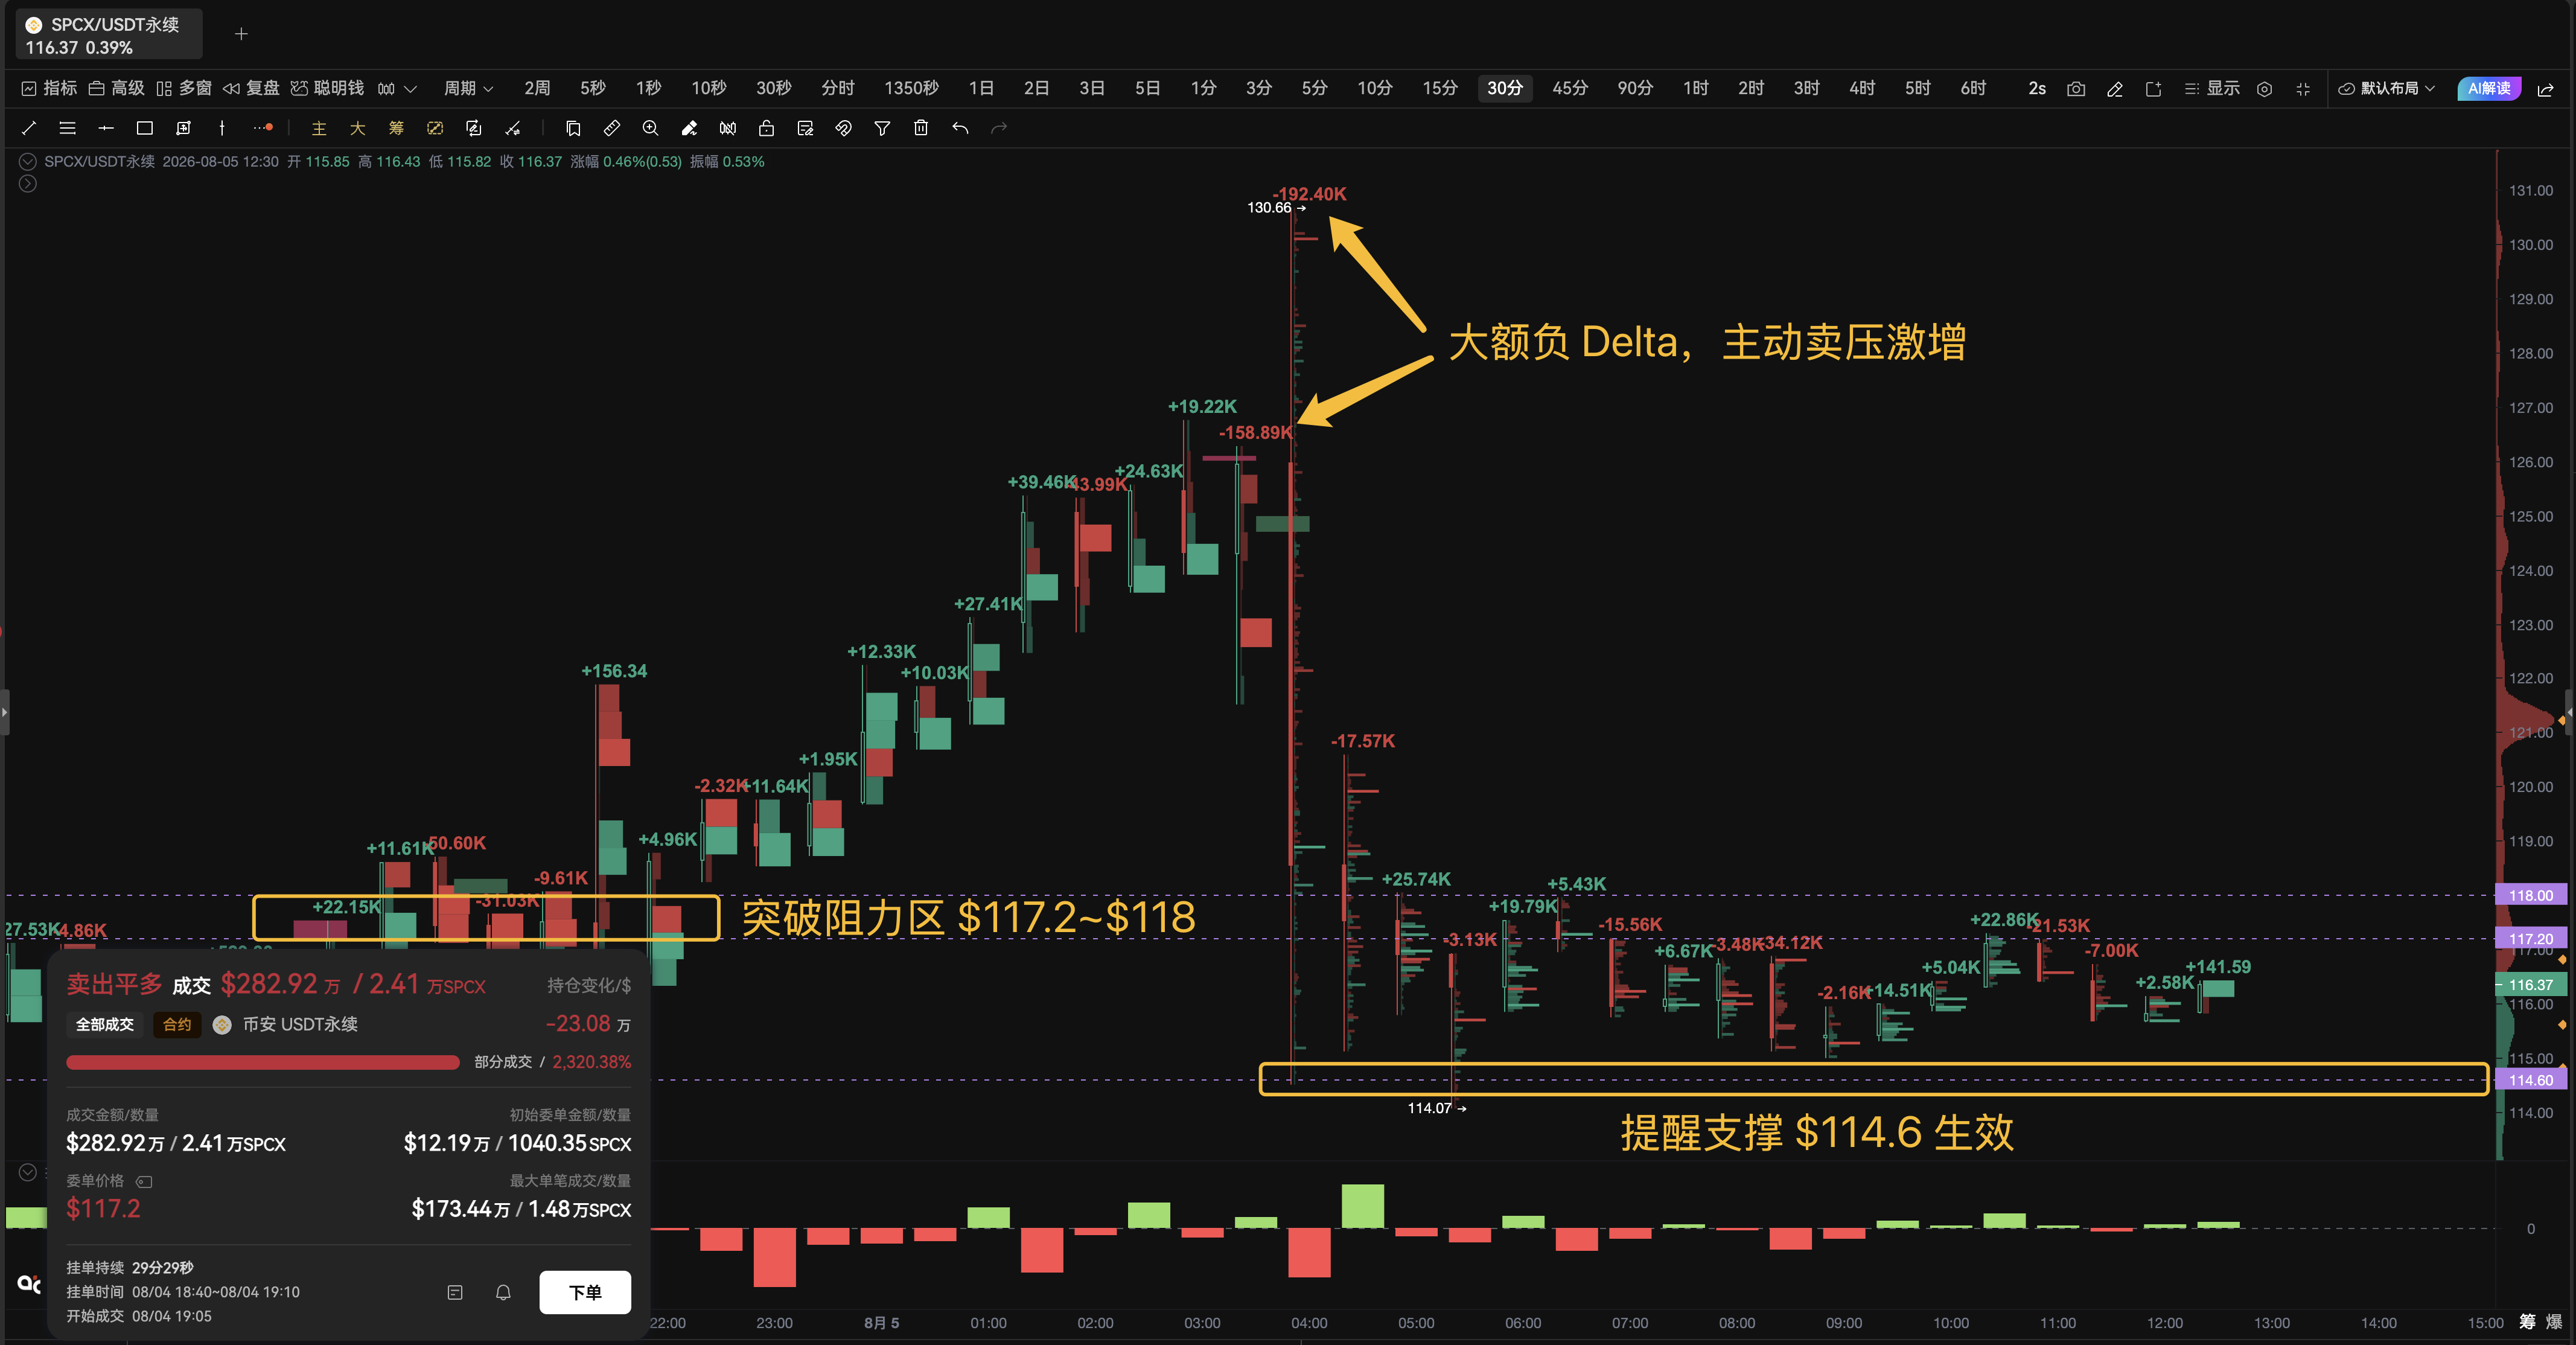
Yesterday at 17:18, PRO News reminded that SPCX's main selling orders are suppressing prices, and the key resistance is at $118; 17: 40. "PRO CLUB" group further reminds: SPCX has a strong short-term trend. If it breaks through $117.2~$118 in volume, there is a chance to rush towards $120+. As a result, the main selling order of $117.2 was ultimately sold for $2.8292 million, and the selling wall was eaten up by active buyers. The price immediately broke through, reaching a high of $130.66. But a second signal quickly appeared at the high level: the footprint chart recorded a continuous Delta of -158.89K and -192.40K, indicating a concentrated release of active selling, and the price quickly fell back to $114.07, with the suggested support level of $114.6 taking effect. This footprint map indicates two trading signals: -After the sale of the wall, the price increased and it was confirmed that the breakthrough was effective; -The high negative Delta surge reminds sellers that they have taken over and avoid continuing to chase higher prices. In the short term, we need to continue to pay attention to changes in the footprint map -If Delta amplifies and drives the price to break through, the rebound will have a basis for continuation; -If the negative Delta strengthens again and falls below support, the weakness is still ongoing. Now activate PRO and unlock the "Footprint Map" indicator, providing an additional criterion for daring to follow when breaking through and braking promptly when selling pressure occurs. The data is for reference only and does not constitute any investment advice.