Loading...
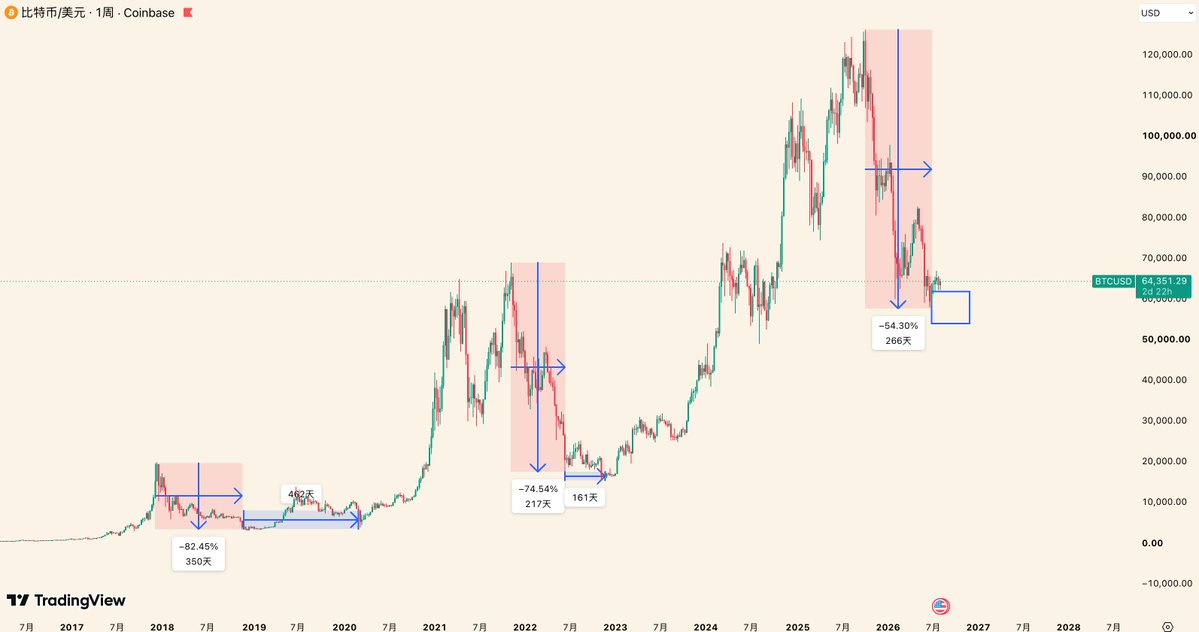
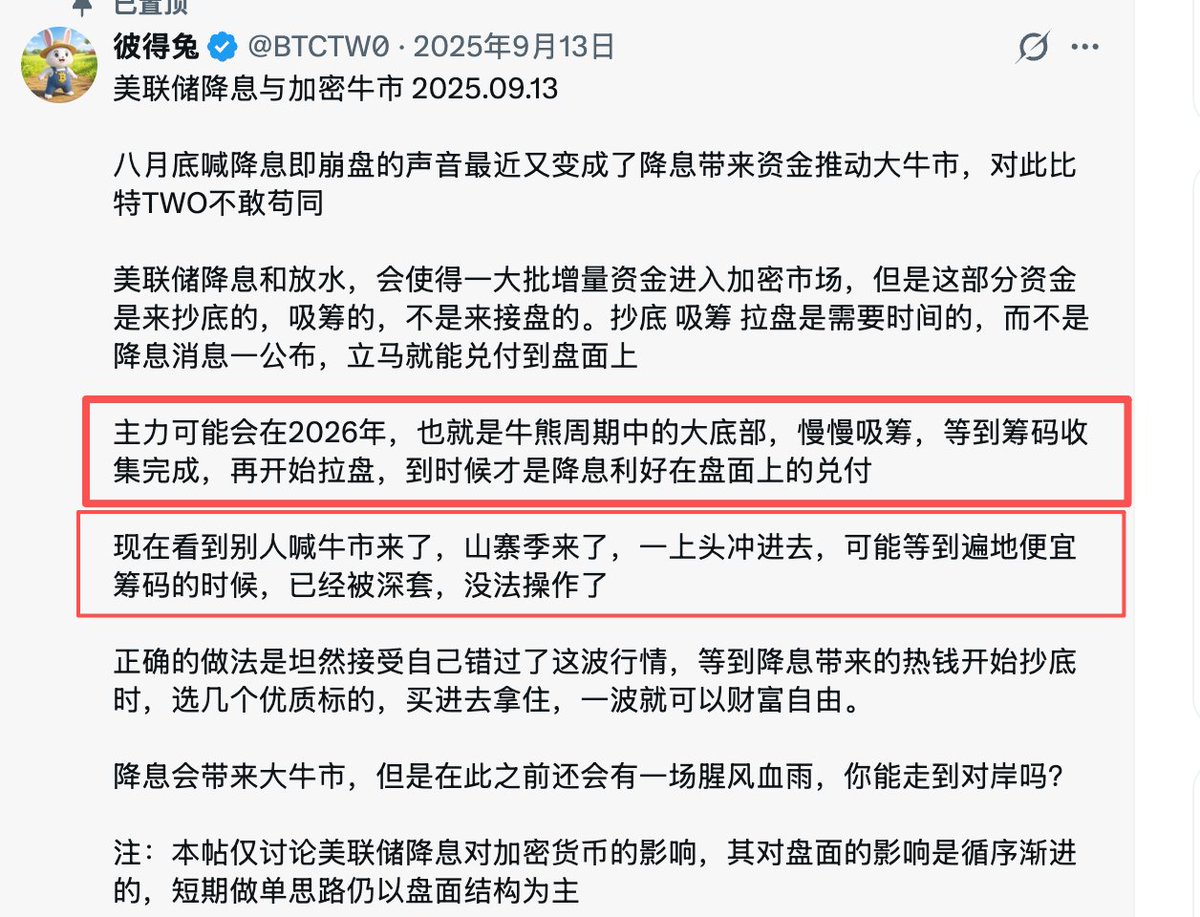
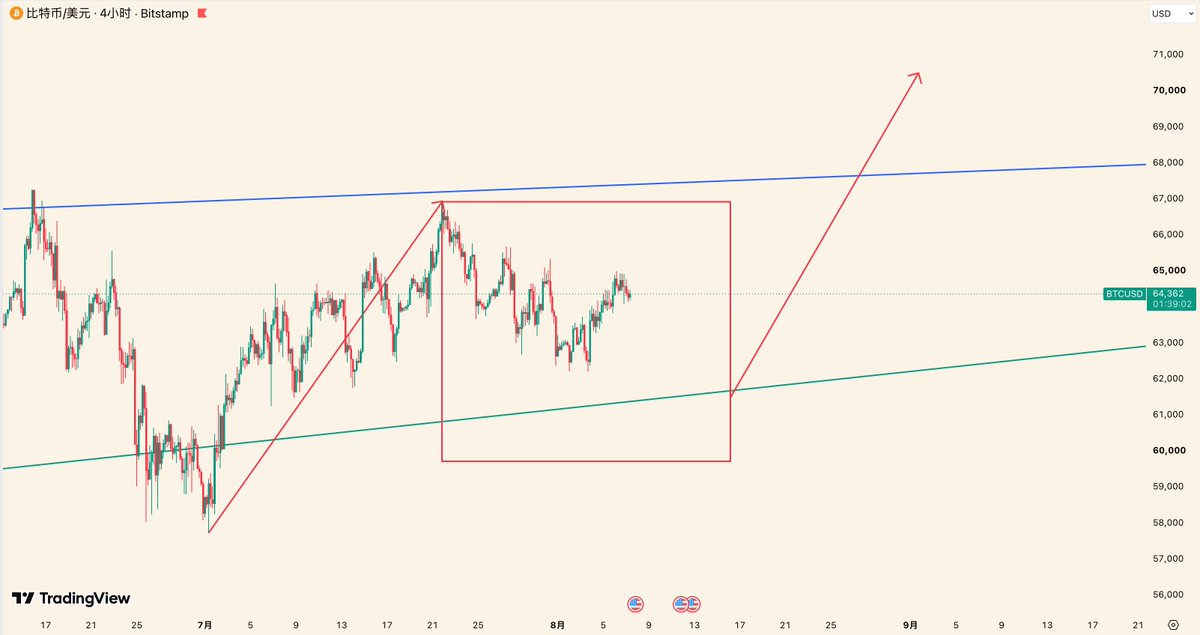
You might not believe it, but BTC could be heading for the shortest bear market in history! As shown in Figure 1, after BTC hit its first bear market low at the end of 2018, the main players spent 462 days accumulating before starting the rally. Surprisingly, this time frame was shortened to just 161 days after the bottom on June 13, 2022. Not only was the duration shorter, but trading volume also hit a historical high. So, will the bear market that started in October 2025 be even shorter? As early as my tweet on September 13, 2025, I clearly told everyone that rate cuts are not bullish—they’re actually a sign that the bull market is about to end. I even predicted a year in advance that the main players would start accumulating in Q3 and Q4 of this year. Long-time followers who carefully read the tweet in Figure 2 likely avoided getting trapped at the peak. The next key Gann timing is mid-November 2026. If we see the same price-time resonance behavior within this time window as in the previous two cycles, we might be able to pinpoint the end of this bear market. Remember this—BTC’s main players have already started accumulating, and I told you about this script back in September 2025. "Short-term strategy": Treat the 57,800–66,956 range as one wave of upward movement (red line segment on the left in Figure 3). For now, consider the red box in Figure 3 as a pullback targeting this range. If we continue to fail to break through our observation point at 65,200, it means the adjustment isn’t over yet. Once we identify the adjustment’s endpoint, we can expect at least another wave of upward movement on the same scale as 57,800–66,956, with the endpoint reasonably landing above 70K.