Loading...
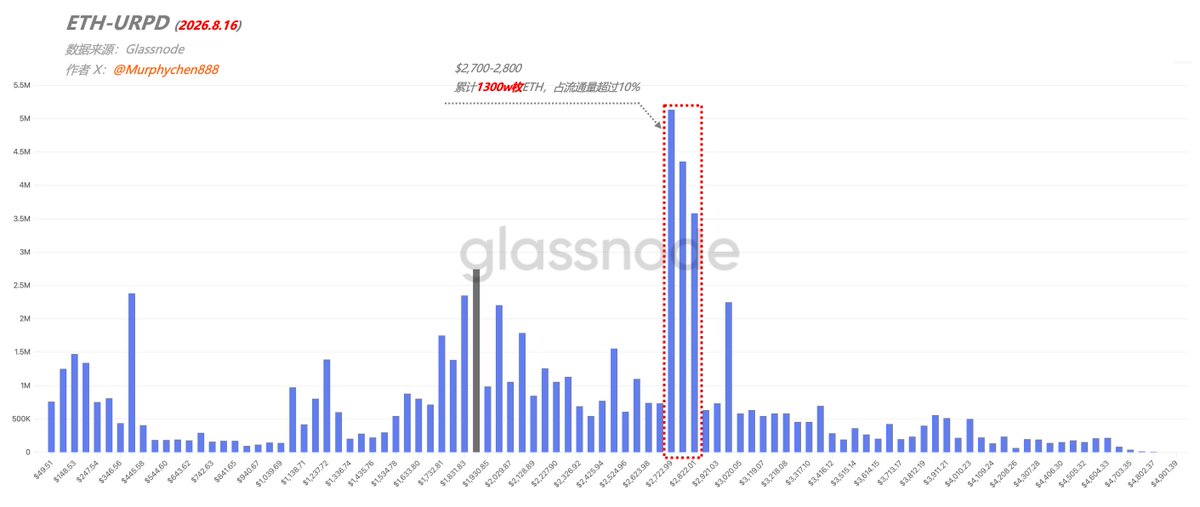
ETH Data Part 2: Breakdown of Token Distribution The URPD for ETH shows a particularly high token bar in the $2,700-$2,800 range, with the three bars combined totaling around 13 million tokens, accounting for over 10% of the circulating supply. What’s interesting is that this batch of tokens is at a 40% unrealized loss but has barely moved. First, it’s important to note that ETH’s URPD mechanism is based on an account model. Glassnode calculates the weighted average cost using the total balance of each entity. For example, in February, BitMine held 4.32 million tokens, with an average cost of around $3,100 at the time. By August, they added another 1.48 million tokens, purchased at prices roughly between $1,500 and $2,200. After the merge, their weighted average cost settled around $2,700. The scale of holdings, cost position, and movement direction all align. This means the main entity behind this token bar can basically be identified as BitMine. Of course, there may also be other clustered entities mixed in. There are two additional reasons for this: 1. The dense trading zone from January this year; 2. On-chain staking. Combining this with what we mentioned yesterday—ETH’s Herfindahl Index hitting an all-time high—it indicates that certain large accounts are monopolizing supply, leading to increasing token concentration. The direct benefit of this is that when prices drop, a large amount of liquidity is locked up and won’t turn into selling pressure. On the flip side, when ETH prices return to this range, whether these tokens remain steadfast and whether they create resistance to an upward trend will depend on ETH’s narrative and consensus at that time.