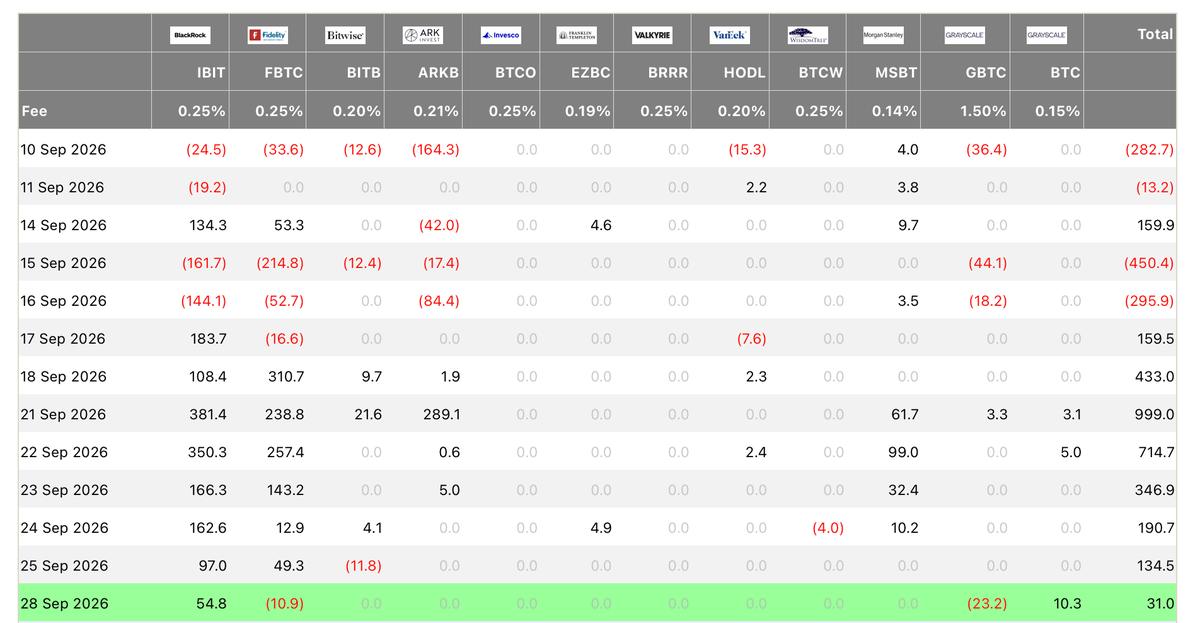
Why hasn't the price of $2.39 billion flowing into BTC ETF kept rising along with it? Last week, the cash flow of the US spot BTC ETF looked very strong. From September 21st to 25th, there was a net inflow of approximately $2.39 billion for five consecutive trading days. If you only look at this number, you are likely to think: With so much money to buy BTC, shouldn't the price continue to rise? But we can break down the daily data to see: September 21st:+999 million US dollars September 22nd:+715 million US dollars September 23rd:+347 million US dollars September 24th:+191 million US dollars September 25th:+135 million US dollars On September 28th, the entire US spot BTC ETF still had a net inflow that day, but only $31 million remained. That is to say, during this period, it's not that the funds suddenly stopped buying, it's that the money is still flowing in, but the inflow rate has been decreasing for several consecutive days. This is also a pitfall that is easy to fall into when looking at ETF data: a positive net inflow does not necessarily mean that buying is becoming stronger. +$999 million and $31 million are both 'net inflows', but they clearly represent different levels of funding. Moreover, ETFs are only a part of the market. There may be people buying ETFs, taking profits in the spot market, closing positions in the contract market, miners, long-term holders, or other funds may also be selling. So what ETF net inflows tell us is just how much more money is bought through this channel than sold. It cannot answer alone how much BTC will definitely rise next. What's really worth looking at in this table is not only 'positive numbers for 6 consecutive trading days', but also the rightmost column: 999.0 → 714.7 → 346.9 → 190.7 → 134.5 → 31.0 The direction hasn't changed, but the speed keeps changing. In the future, when we see 'ETFs still have net inflows', we need to see how big the faucet is today.