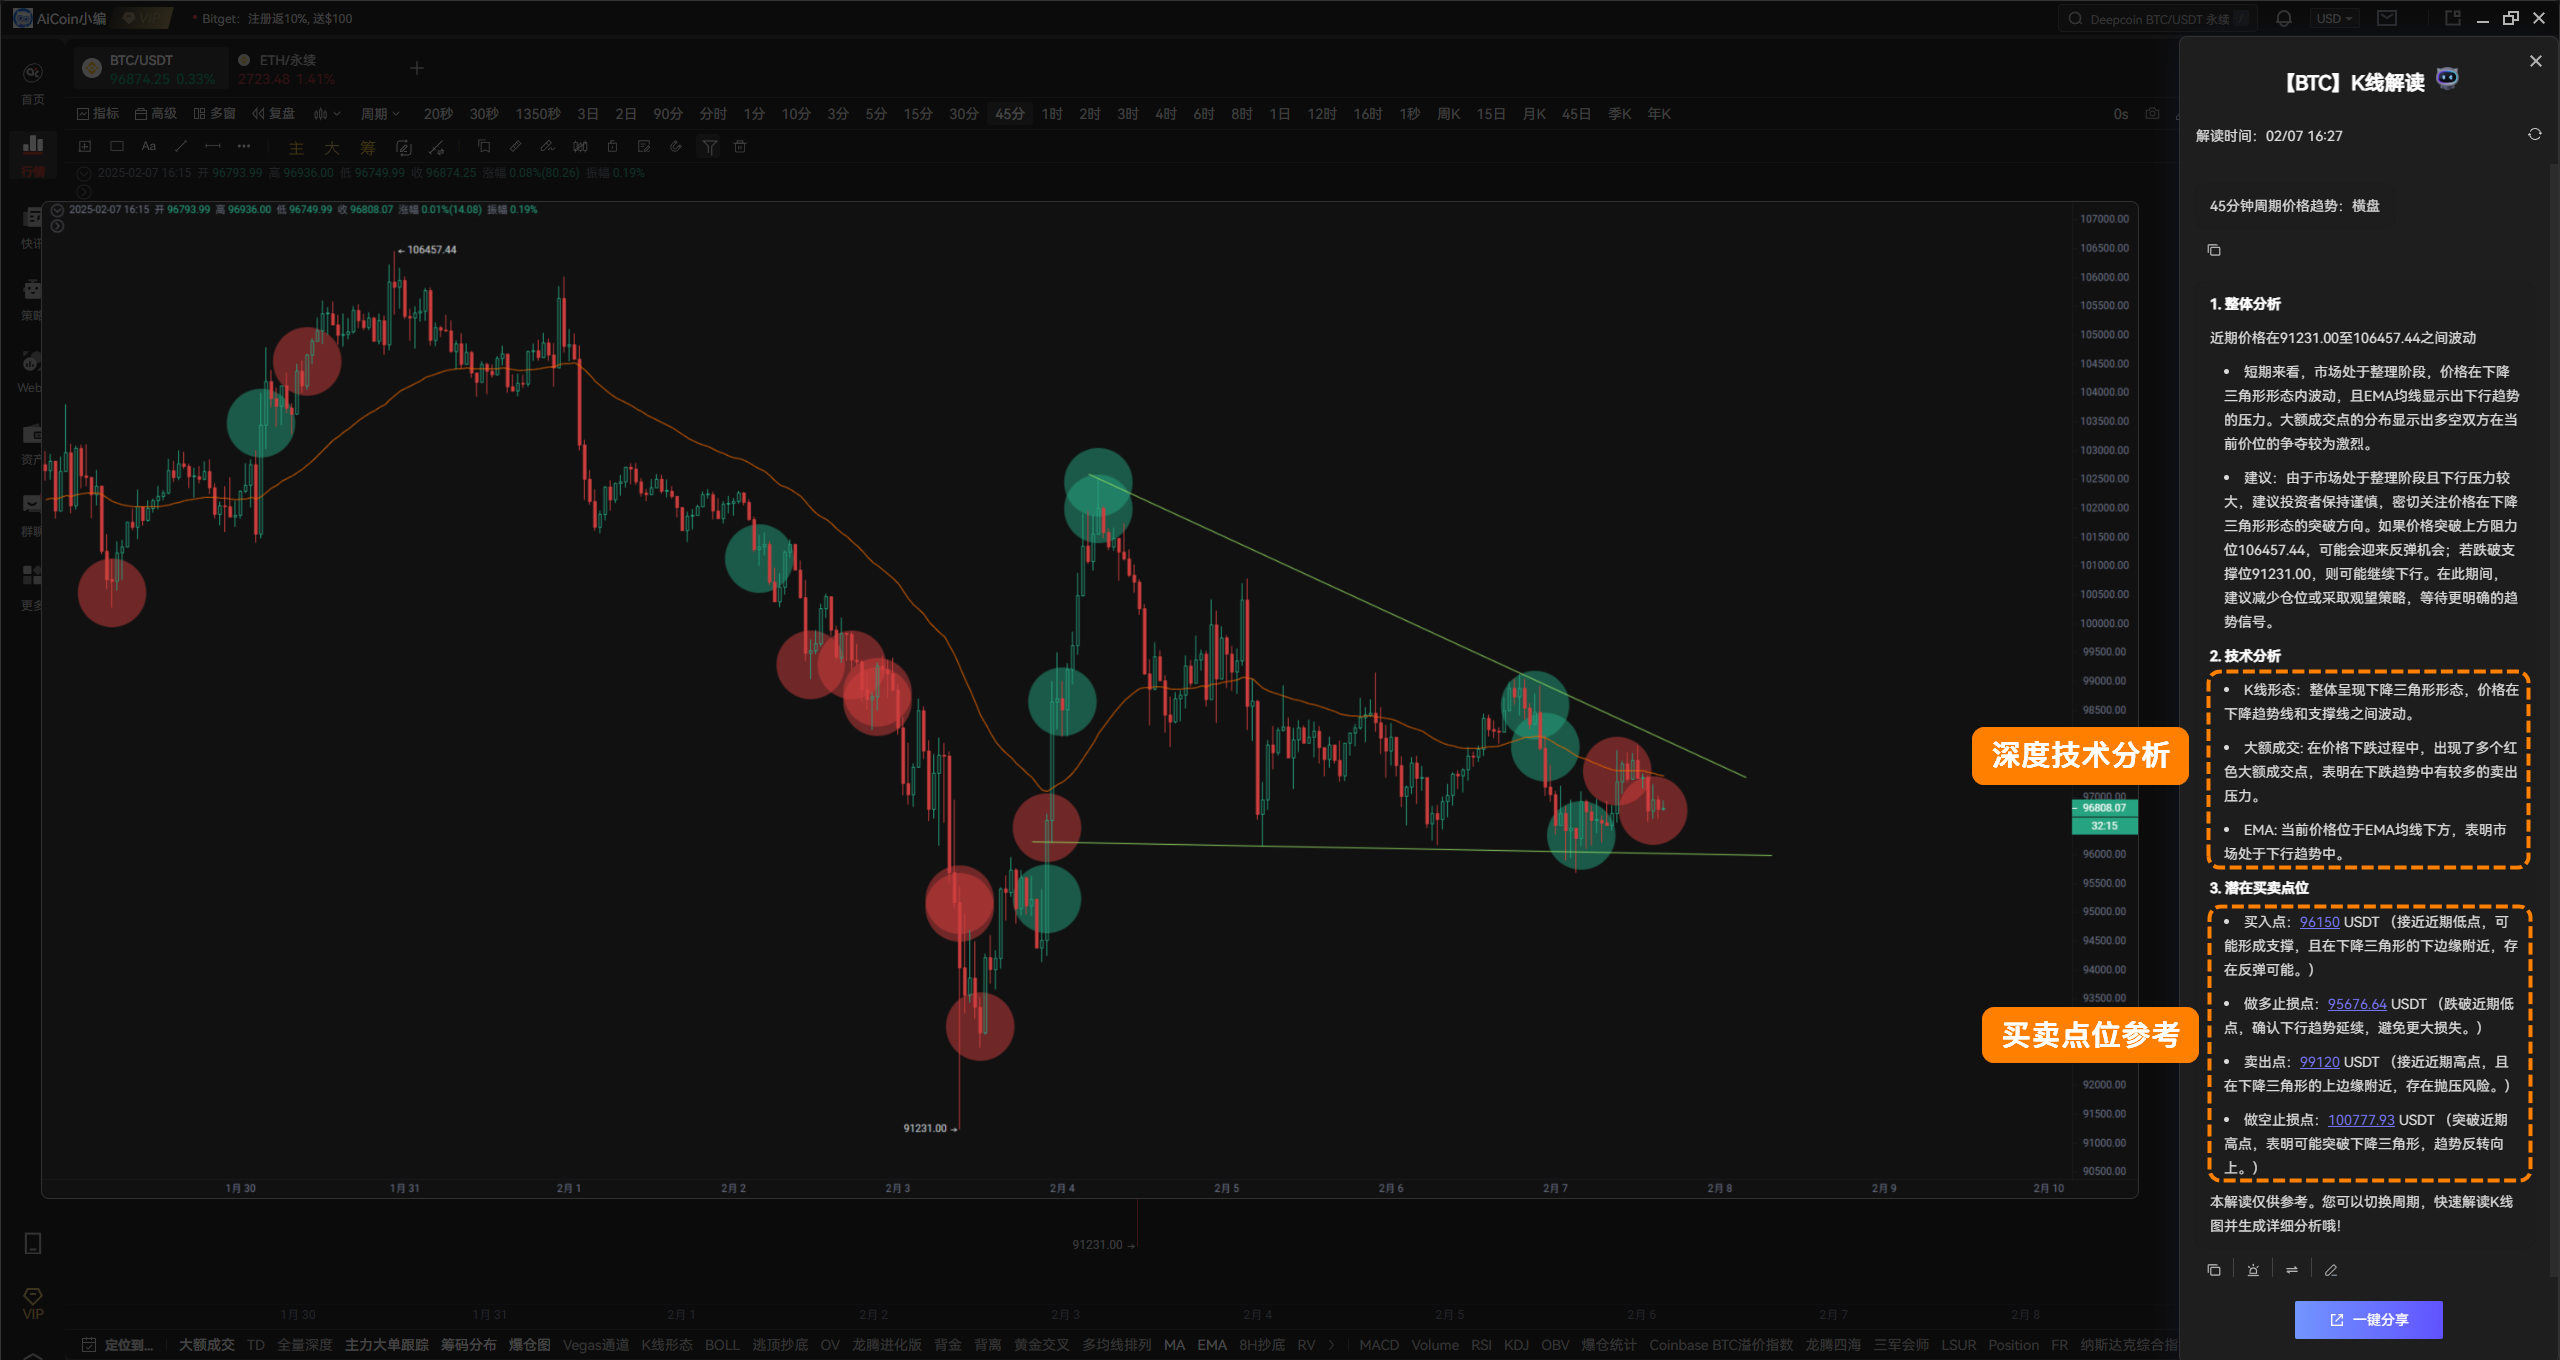
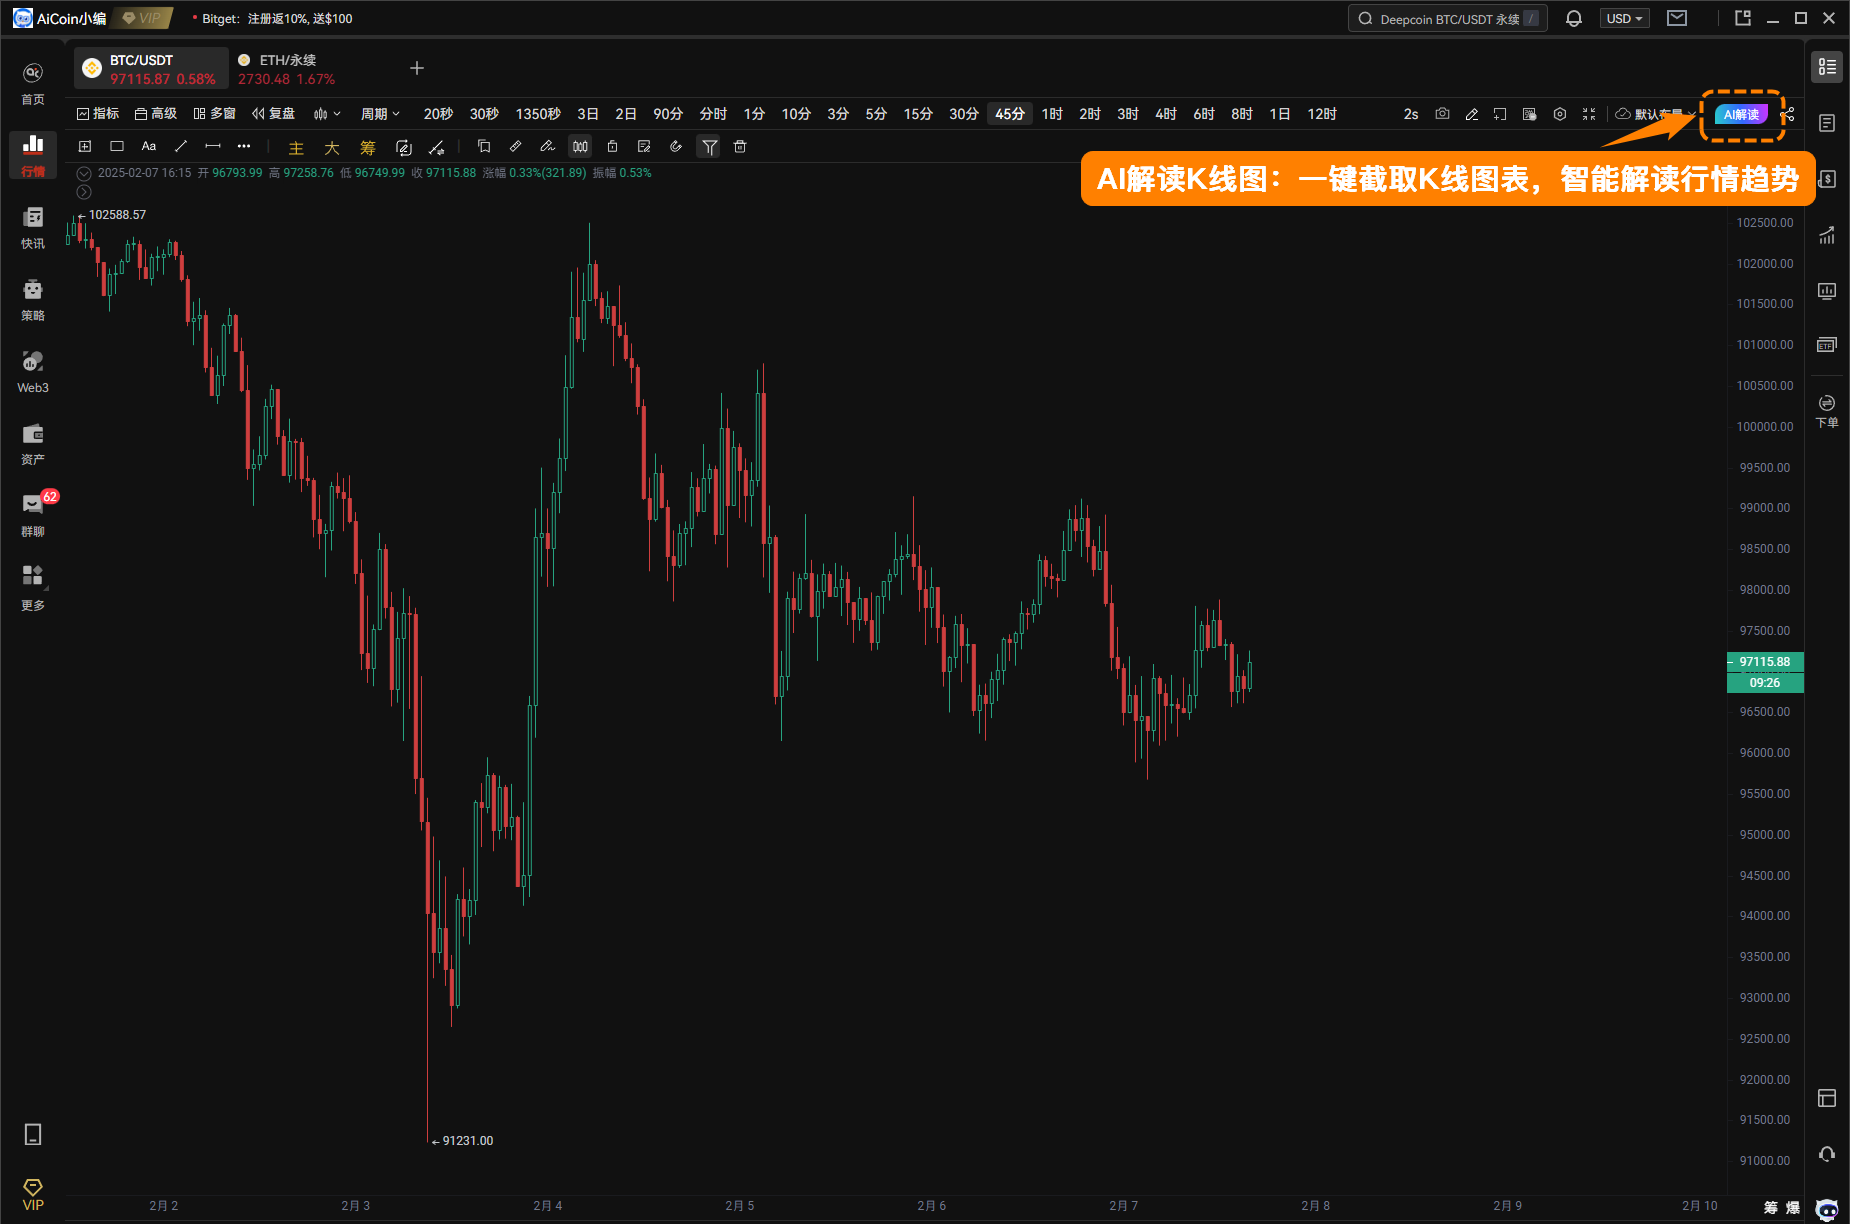
Want to quickly grasp market trends and accurately capture buying and selling points? AI intelligent interpretation of K-line function, one click scanning of market trends, helping you gain insight into market trends! ✔ Intelligent analysis of K-line patterns and identification of key trend inflection points; ✔ Deeply analyze technical indicators and quickly analyze market trends; ✔ Accurately mark potential buying and selling points to reduce the risk of blind trading. According to the latest interpretation, BTC has shown a downward triangle shape in the 45 minute custom cycle, while the main selling pressure has increased, technical indicators are bearish, and short-term consolidation is the main trend. Attention should be paid to the risk of pullback, and the potential buying and selling points are: Buy point: 96150 USDT (Near recent low, may form support, and near the lower edge of the downtrend triangle, there is a possibility of rebound.) Long stop loss point: 95676.64 USDT (Breaking below recent lows, confirming the continuation of the downward trend and avoiding greater losses.) Sell point: 99120 USDT (close to recent highs and near the upper edge of the downtrend triangle, with selling pressure risk.) Short Stop Loss Point: 100777.93 USDT (Breaking through the recent high indicates the possibility of breaking through the downtrend triangle and reversing the trend upwards.) Whether you are a novice or a professional trader, AI interpretation of candlesticks can help you make faster decisions and seize market opportunities! Special statement: The above interpretation is for reference only!