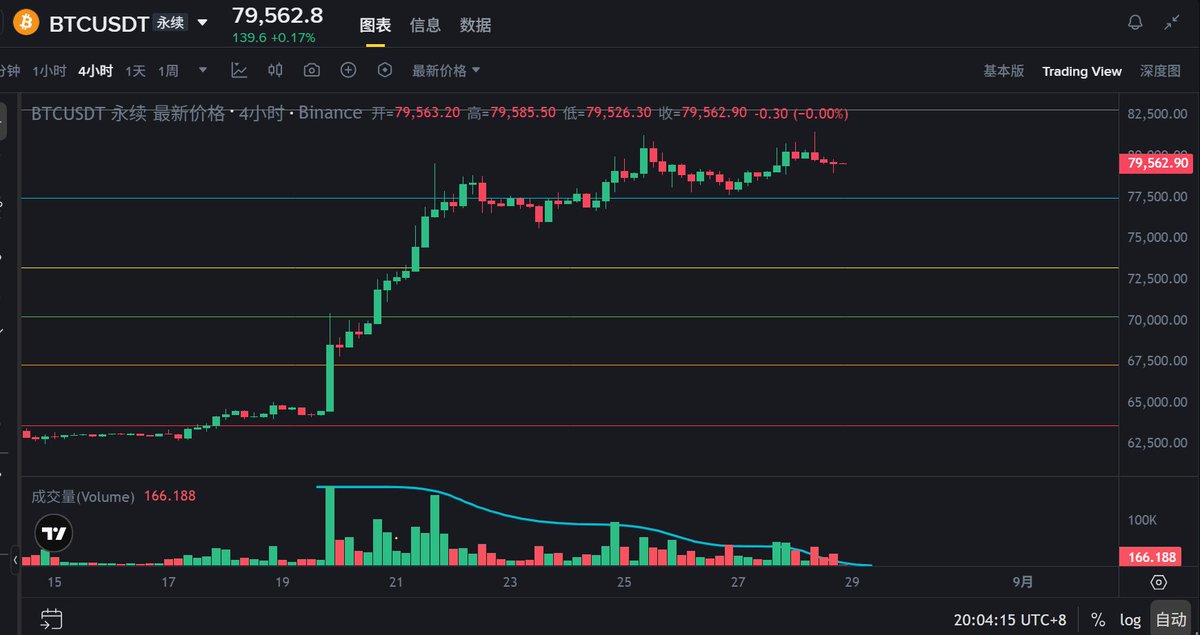
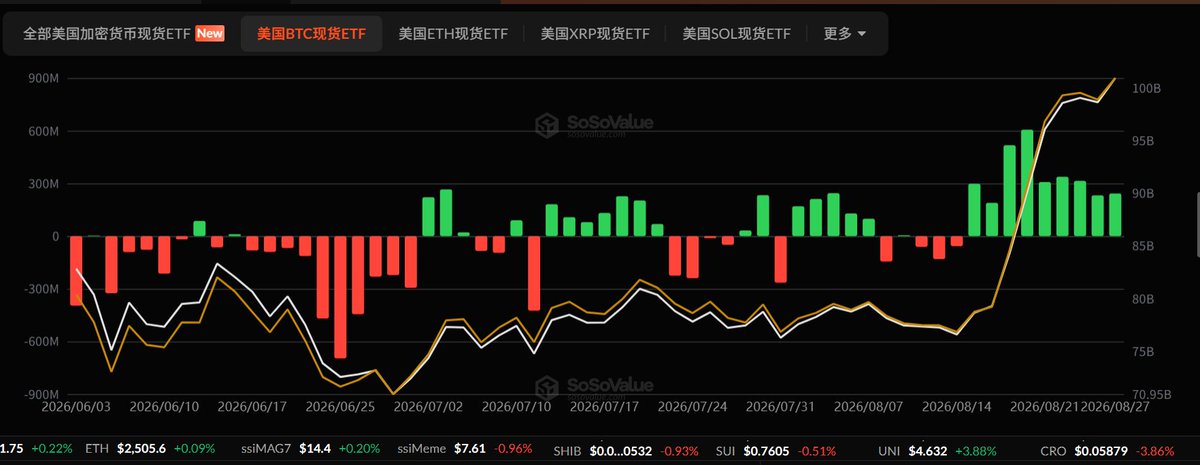
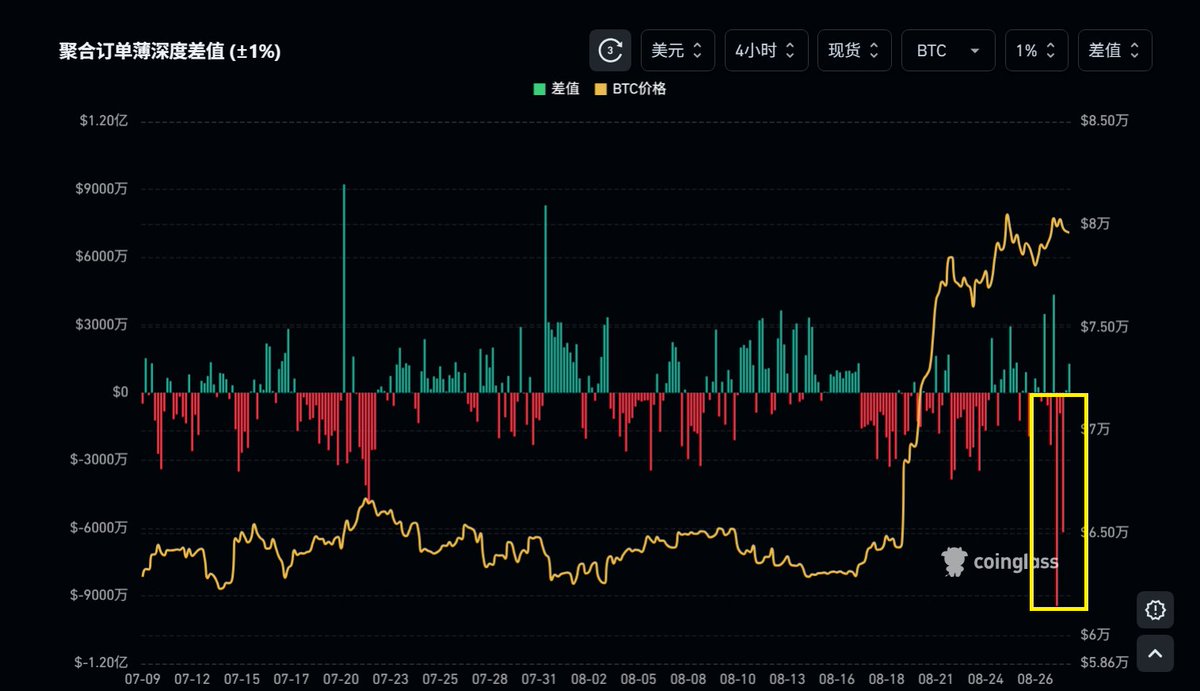
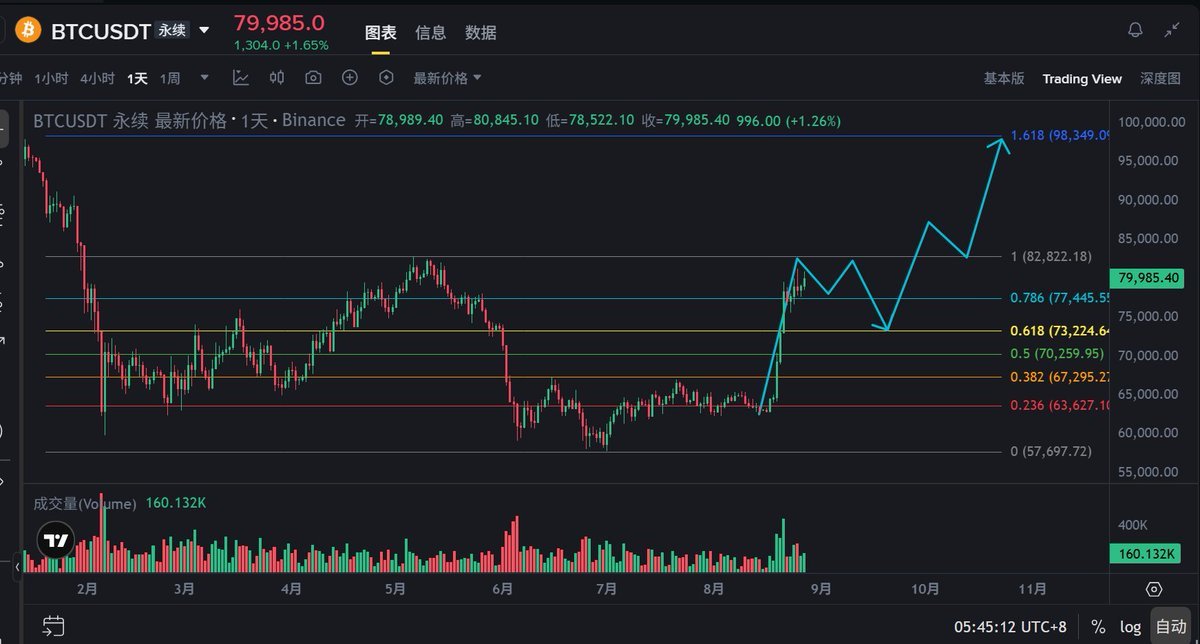
Three dimensional integrated trading system | Latest BTC market trends at night 》 —— ⚡ The bearish signal has appeared, and both long and short sides seem to be deadlocked, but there is a high probability that there will be a downward adjustment in the future! Brothers and sisters, BTC has been sawing around 80000 for a week. Tonight there will be option delivery and Walsh's speech. Let's first break down the market structure and the movements of various funds. 1、 Quantity and form: high-level passivation, direction is clear! The 4-hour long position can rise above 81200 and then continue to shrink, while the short position can show local increase in volume in the range of 80000-80500. The strength comparison of long and short positions is transitioning from "long dominance" to "long short balance". A candlestick pattern of "rising and falling" appears continuously at high levels. From the blue bullish energy fluctuation curve in Figure 1, it can be seen that the bullish energy continues to decrease, which is not a good phenomenon but a short selling signal indicating the depletion of bullish energy. In terms of daily trading volume, there was a significant increase in volume (about 1.1-1.2 billion US dollars) when it exceeded 80000 on August 25th, followed by a gradual decline in trading volume in the following trading days. The combination of high volume contraction and price stagnation indicates that the funds for chasing high prices are decreasing, and the market is in a "wait-and-see" state, with a deviation from quantity and price forming. This is also a bearish signal. Quantitative judgment: The 4-hour bullish momentum is diminishing, and the bullish and bearish forces are tending towards equilibrium. The daily contraction has stagnated, and the short-term direction is unclear, waiting for the catalyst to break the balance. 2、 On chain data and order book: Two forces are deadlocked, but bearish signals have emerged! Who is buying: ETFs and whales are the clear main players. ETFs continue to attract funds and are the most important source of buying in the market. BlackRock IBIT's net inflow in the past 24 hours was approximately $278 million, reaching a new high in nearly a week. Overall, US spot ETFs have seen net inflows for 8 consecutive trading days, with a cumulative total of approximately $3.3 billion in August, marking the strongest monthly performance since 2026. This is a continuous buying of real gold and silver, not a one-day trip. Please refer to Figure 2. However, ETF institutions have always been lackeys, so please remember this viewpoint. The giant whale is also laying out. Garrett Jin's address added 600 BTC multiple orders (approximately $47.4 million) at the price of $79000. Another whale on the chain has deposited 10 million USD in USDC and opened 7000 ETH positions. Big funds are not retreating from this position, but rather increasing their holdings. Who is selling: Long term holders are accelerating redemption. CryptoQuant data shows that long-term holders (LTH) had a net increase of 286000 BTC per month in early June, but now have a net decrease of approximately 21000 BTC per month. The number of BTC transferred to the exchange by long-term holders has reached its highest level since 2026, with over 297000 BTC transferred by holders between 6-18 months, making them the most active seller group in recent times. At the same time, SOPR has rebounded to 1.48, and a large number of profitable chips are being redeemed. According to Glassnode data, the range of 80000 to 86000 is a 'supply wall', 83000 to 86000 is the first key supply area, and $80800 is the first self hosting cost base platform. Who is watching: The critical point of long and short revealed by the order book. In terms of the order book, there are dense consignment sell orders in the 80500-80800 range, which is a clear "red sell wall", corresponding to the super large consignment sell order hanging on the red column in Figure 3. This is a consignment sell order worth approximately 913 BTC and $73.77 million on Coinbase yesterday, which continued to increase after being listed at $80808. Today, BTC rose to a high of $81479, and this pending order has been fully redeemed through a cycle of "partial transaction → cancellation → re pending", which is a typical market maker or institutional shipment signal. The range of 78300-78700 below forms a buying support of approximately $70 million, which is the first line of defense. The CVD line for large orders (in the range of 1 million to 10 million US dollars) is flat or slightly declining, and institutional funds are mainly selling or waiting. Small and medium-sized orders (100-1000 US dollars) have seen a moderate increase in CVD, with retail investors buying in. The two forces are hedging against each other, and the difference curve is rising from negative to near zero. The long and short forces are approaching equilibrium, and the direction is about to be chosen. Conclusion: ETFs and whales are continuously buying, while long-term holders are systematically selling. Two forces are simultaneously increasing their strength, and the red selling wall of 80500-80800 is the focus of this game. Whoever cannot hold on first will turn in the right direction. Once ETF spot institutions stop buying and funds shift from net inflows to net outflows, the price of Bitcoin is likely to decline; 3、 Key positions Upper resistance: 82000-83000 (500 day moving average+supply intensive area defined by Barrett Jin); Bottom support: 76600-78500 (short-term holder cost basis). The target price for the decline is 75000; Falling target price of 73500; The target price for the decline is 71500. Xiaolong perspective and core judgment Tonight, there are two variables: $6.4 billion option delivery and Walsh's speech. The biggest pain point of options is concentrated in the range of 80000-81000, and market makers' hedging behavior before expiration may temporarily "pin" the price in this range. Walsh's speech only affects short-term price fluctuations, not the intrinsic driving force of trend direction. The true determinants of the short-term trend direction of Bitcoin price are quantity and capital. From the above analysis, multiple forward-looking bearish signals have emerged: (1) Space signal: The price has risen to the previous high point around 82000, with significant resistance and a price drop; (2) Quantitative energy signal: a four hour level fluctuation curve of quantitative energy, with multi head quantitative energy decreasing; (3) Quantity price signal: The daily chart shows a mild deviation between quantity and price, with multiple upper shadow lines; (4) On chain data signal: There is a large amount of pending sell orders on the order book, and long-term holders are selling BTC. These signals indicate that there is a high probability that Bitcoin will experience a downward correction in the future. ETF institutions have been experiencing net inflows for 8 consecutive days, which has only delayed the downward adjustment time. It should be noted that ETF institutions are like wall grass, they are only the backbone force that helps rise and fall. My core statement: Bitcoin is highly likely to experience a downward correction, with the maximum probability of its target price falling to around 73500. The subsequent downward adjustment is not a bear turn, but a healthy correction in the initial stage of the bull market, which is an opportunity to get on board, as shown in Figure 4.